
 Email Alerts
 RSS
RSS
Study on flow recovery distance under different discharge conditions of hydro-power station
-
摘要: 计算水流的恢复距离,可以分析下游引航道口门区的通航水流条件是否受到了上游电站在不同泄流工况下的影响,进而可为电站的调度运行提供参考。以景洪电站为研究背景,分析了发电、控泄发电及敞泄停机这3种工况下的水流沿程分布情况,并与无坝全断面泄流工况的水流沿程分布情况进行比较,提出了水流恢复距离的概念,计算了不同工况下的水流恢复距离。结果表明,两侧泄流的恢复距离均大于中段泄流的恢复距离,泄流宽度所占的比例越大,恢复距离越短,泄流流量越大,恢复距离越长。通过对全断面泄流工况和极限泄流工况在引航道口门区水流条件的对比可知,当水流恢复距离大于引航道的长度时,相对应的泄流工况会造成引航道口门区水流条件明显的变化,此时需要考虑电站泄流对下游通航的影响。Abstract: By calculating the recovery distance of water flow, it can be known whether the navigable flow condition in the downstream approach entrance area is affected by the upstream power station under different discharge conditions, which can provide a reference for the dispatching operation of the power station. Taking Jinghong Hydropower Station as the research background, we analyse the flow distributions along the river under three conditions: power generation, controlled discharge power generation and open-discharge shutdown, and those are compared with the flow distribution under the condition of full sectional discharge without dam. The concept of flow recovery distance is put forward, and the flow recovery distances under different conditions are calculated. The results show that the recovery distance of both sides is larger than that of the middle section. The larger the proportion of discharge width, the shorter the recovery distance; and the larger the discharge, the longer the recovery distance. By comparing the flow conditions in the approach entrance area under the full sectional discharge and the limit discharge condition, it can be seen that when the water recovery distance is greater than the length of the approach channel, the flow conditions in the approach entrance area will obviously change under the corresponding discharge condition, then the influence of the discharge from the power station on the downstream navigation should be considered.
-
对未建大坝的天然河道进行流场模拟时,为了获得较好的来流边界,通常将进口选在较为顺直的河段,并且假定进口流速或单宽流量均匀分布。但当大坝建成后,计算域进口位置只能选择大坝断面,但发电、控泄发电、敞泄停机等不同工况下的电站泄流(即计算域进口来流边界)大不相同。特别是在开展引航道口门区通航水流条件研究时,由于引航道紧靠坝下,如仍采用无坝情况的均匀来流边界,必然会与实际情况造成较大误差。电站无论以何种方式泄流,距坝下一定距离必然会出现流速大小及分布恢复到无坝全断面泄流工况的断面,这个断面与大坝之间的距离为恢复距离,并将此断面定义为恢复断面。分析不同泄流方式下的水流恢复距离,对分析电站分散泄流对引航道口门区通航水流条件的影响具有重要意义。
引航道口门区水流呈现出复杂的三维特性[1-2]。水流恢复距离的大小受泄水闸的开启方式[3-9]、泄洪闸的位置[10]、电站的调节方式[11]、船闸的冲泄水方式[12]等影响,目前针对水流恢复距离等相关研究成果尚不多见。本文针对景洪电站发电、控泄发电、敞泄停机等工况下的水流沿程分布进行数值模拟研究,以探究水流恢复距离,进而对电站的调度运行提供参考。
1. 工程概况
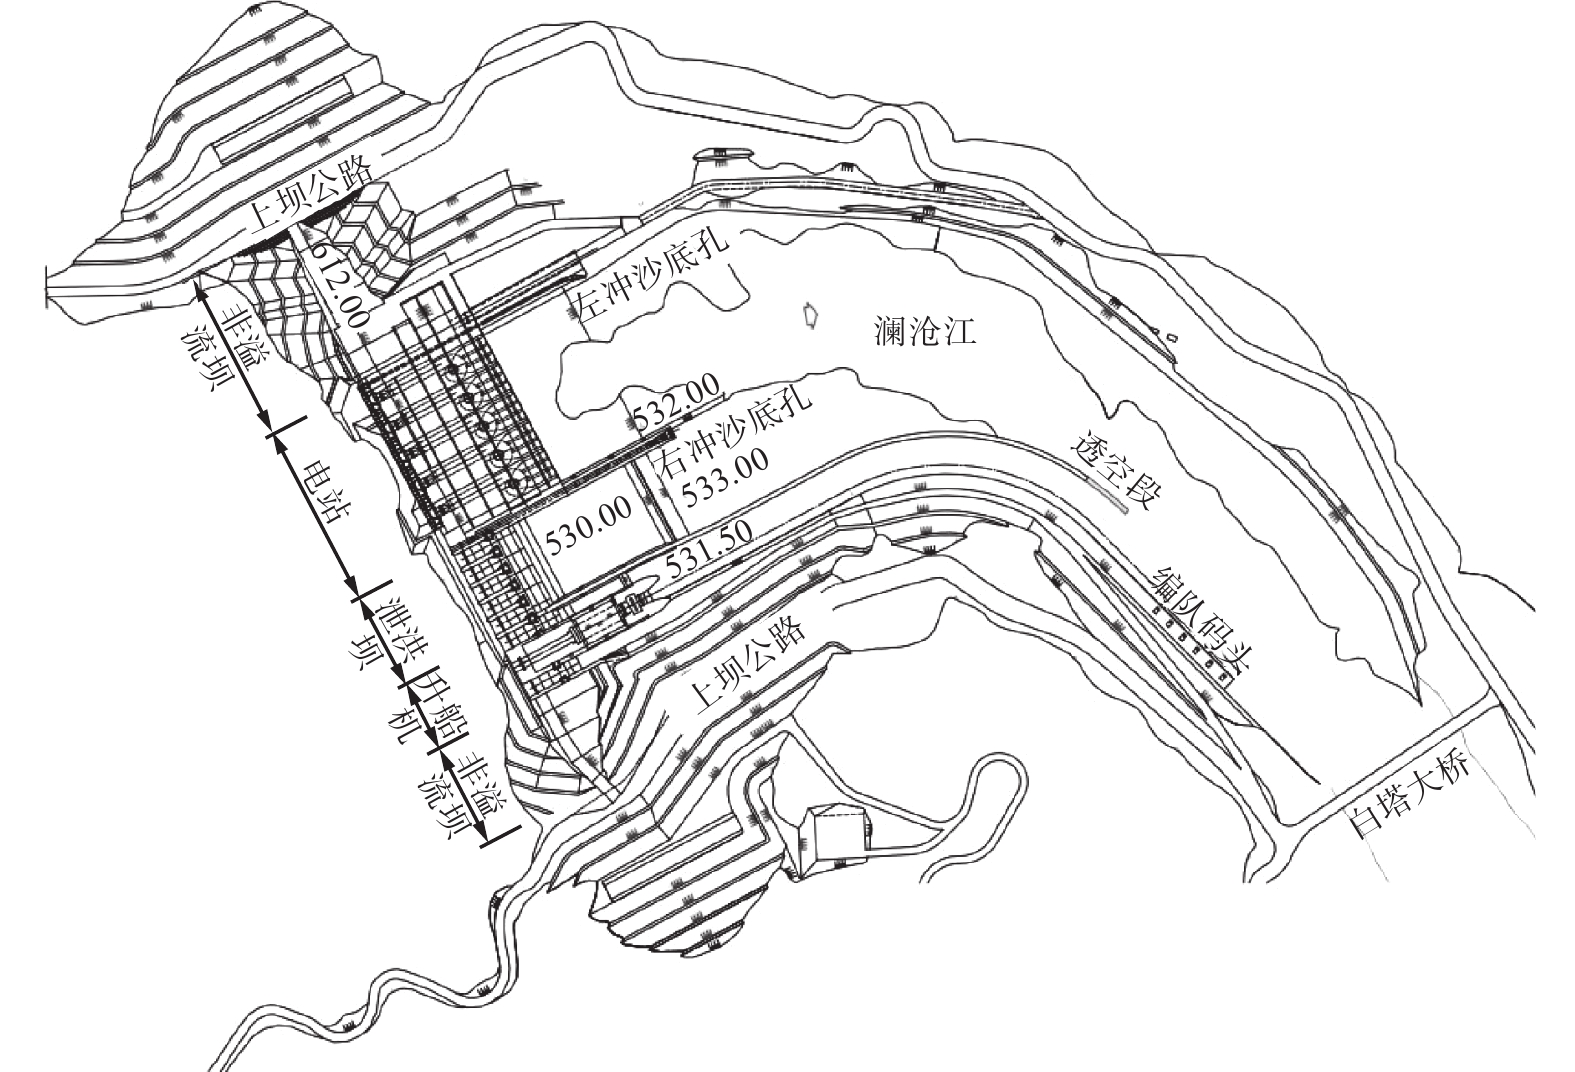
景洪电站位于澜沧江干流下游,云南省西双版纳州首府景洪市北郊约5 km处,介于思茅港—中缅243号界碑5级航段上,是澜沧江中下游梯级开发规划中的第6级电站。该工程是以发电为主,兼顾航运,并具有防洪、旅游等综合利用效益的大型水利枢纽工程。水库正常蓄水位602.0 m,死水位591.0 m。枢纽主体工程包括:左右岸混凝土重力坝段、泄洪闸段、冲沙底孔、坝后式电站厂房、右岸垂直升船机等建筑物,船闸级别为4级,电站与升船机采用异岸布置于河床右侧。下游引航道紧邻河道右侧凸岸,长约601 m。最高通航流量为7 100 m3/s,最低通航流量为504 m3/s。当日均入库流量在405~504 m3/s时,电站下泄流量不小于405 m3/s;当日均入库流量小于405 m3/s时,按天然入库流量控制下泄。景洪电站坝址处于河道窄弯处,坝轴线位于两反向河道间的过渡段(图1),平面上呈烟斗形,下游引航道紧邻河道右侧凸岸,其左侧河床较高,岸坡较陡,水深较浅,枯水水花强烈,加之其上游受枢纽发电、泄洪等影响,引航道口门区的水流条件将更加复杂,因此有必要对其口门区的水流条件开展研究。根据《内河通航标准》[13]并结合本工程的船闸等级,船闸引航道口门区的水流表面最大流速限制如下:① 纵向流速不大于2.0 m/s;②横向流速不大于0.3 m/s;③ 回流流速不大于0.4 m/s。
![]() 图 1 景洪电站枢纽总平面布置(单位:m)Figure 1. General layout drawing of Jinghong Hydropower Station (unit: m)
图 1 景洪电站枢纽总平面布置(单位:m)Figure 1. General layout drawing of Jinghong Hydropower Station (unit: m)2. 研究方法与计算工况
对于电站泄流边界的给定,采用较为简单的方法,进口单元节点切向流速Vτ
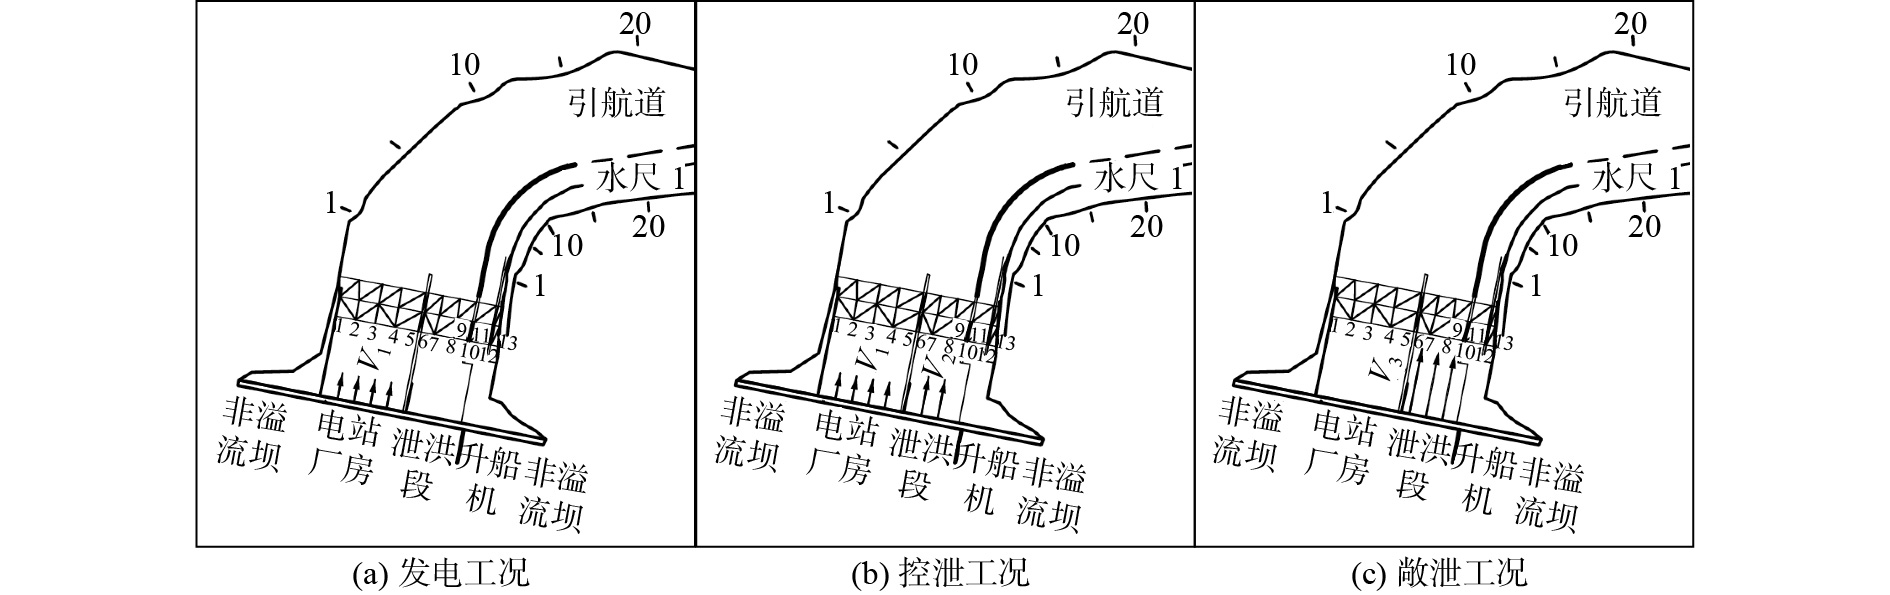
均设为0,法向流速Vn则根据节点所在区域具体确定,如: 发电工况:只有电站厂房段才有水流,则设厂房段的节点Vn=V1,其他段节点的Vn=0。即图2(a) 中节点1~5的Vn=V1,6~13的Vn=0。
![]() 图 2 电站泄流边界处理示意Figure 2. Diagram of discharge boundary processing of hydropower station
图 2 电站泄流边界处理示意Figure 2. Diagram of discharge boundary processing of hydropower station控泄发电工况:电站厂房和部分泄洪段有水流,则设厂房段的节点Vn=V1,开启的泄洪闸段节点Vn=V2,其他段节点的Vn=0。即图2(b)
中节点1~5的Vn=V1,6~9的Vn=V2,10~13的Vn=0。 敞泄停机工况:电站厂房、升船机和非溢流坝段无水流,泄流主要集中在溢流坝段,则泄洪闸段全部节点Vn=V3,其他段节点的Vn=0。即图2(c)
中节点1~5的Vn=0,6~9的Vn=V3,10~13的Vn=0。 选用6个流量和13种边界共78组工况组合(表1)进行了流场模拟,用以分析恢复距离。
表 1 电站坝下非全断面泄流恢复距离计算工况Table 1. Calculation conditions of non-full section discharge recovery distance downstream of hydropower station dam泄水边界 不泄水边界 流量/(m3·s−1) 备注 ${\alpha _1}$=1.0 ${\alpha _2}$+${\alpha _3}$=0 504/1 500/3 000/5 000/7 100/8 967 无坝全断面泄流 ${\alpha _1}$=0.2,0.4,0.6,0.8 ${\alpha _2}$+${\alpha _3}$=0.8,0.6,0.4,0.2 左段泄流右段不泄流 ${\alpha _2}$=0.2,0.4,0.6,0.8 ${\alpha _1}$+${\alpha _3}$=0.8,0.6,0.4,0.2 中段泄流两侧不泄流 ${\alpha _3}$=0.2,0.4,0.6,0.8 ${\alpha _1}$+${\alpha _2}$=0.8,0.6,0.4,0.2 右段泄流左段不泄流 注:${\alpha _1}$=b1/B,${\alpha _2}$=b2/B,${\alpha _3}$=b3/B,分别表示左、中、右段泄流宽度占全断面宽度的比例,B=300 m。 3. 计算结果分析
3.1 恢复距离确定标准
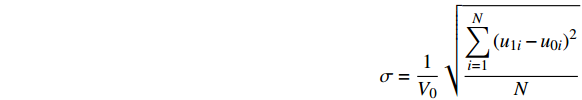
设部分泄流边界工况下某断面某节点的流速为u1i,无坝全断面泄流工况下同断面同节点的流速为u0i,则二者的均方差与全断面泄流工况下同断面平均流速V0的比值
$\sigma $ 为:$$ \sigma = \frac{1}{V_0}\sqrt {\frac{{\displaystyle\sum\limits_{i = 1}^N {\left( {u_{1i}} - {u_{0i}} \right)^2}} }{N}}$$ 均方差越小,数据越聚集,反之,数据越离散。当某断面流速的均方差
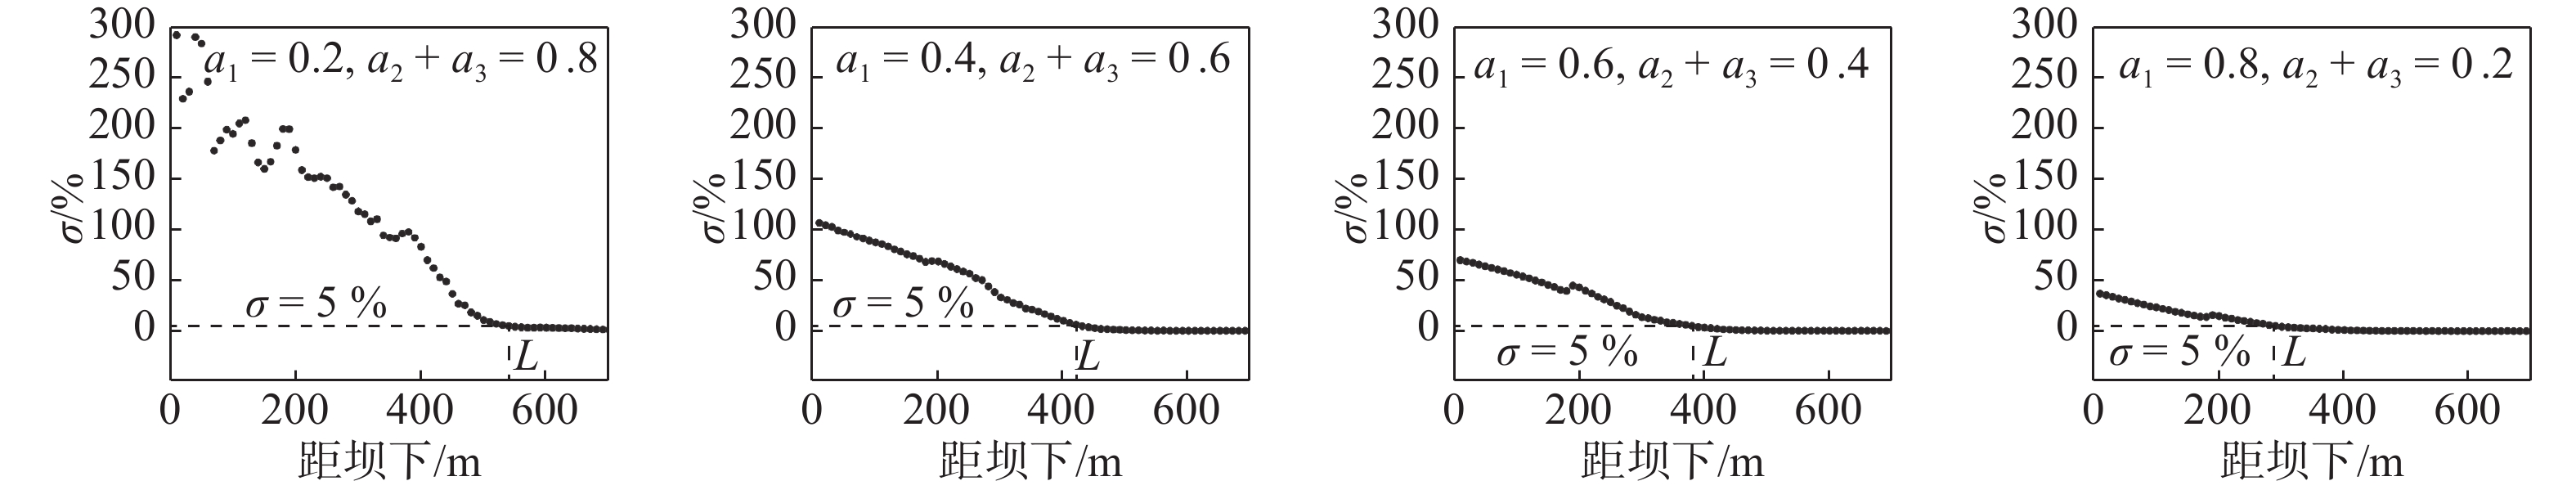
$\sigma \leqslant $ 5%时,则可认为部分泄流工况与全断面泄流工况的水流条件一致,该断面称为恢复断面,其距大坝的长度即为恢复距离L。图3是Q=3 000 m3/s时典型工况的计算结果。从图3可知,泄流边界
${\alpha _1}$ 所占的比例越小,水流的恢复距离越长。根据$\sigma \leqslant $ 5%的判断条件,可得各工况的恢复距离(表2)。表 2 各工况的恢复距离Table 2. Recovery distance of each working condition泄流边界 不同泄流流量下的恢复距离/ m 504 m3/s 1 500 m3/s 3 000 m3/s 5 000 m3/s 7 100 m3/s 8 967 m3/s ${\alpha _1}$=0.2 423.6 473.8 540.4 602.2 675.5 739.3 ${\alpha _1}$=0.4 407.5 415.0 428.4 458.6 486.5 512.4 ${\alpha _1}$=0.6 387.1 393.0 400.0 416.2 431.1 445.0 ${\alpha _1}$=0.8 210.5 258.1 291.3 314.2 344.8 371.1 ${\alpha _2}$=0.2 311.1 425.6 437.9 534.4 611.1 684.2 ${\alpha _2}$=0.4 271.4 338.5 387.9 408.4 443.9 472.4 ${\alpha _2}$=0.6 197.0 262.7 295.9 333.0 374.2 410.3 ${\alpha _2}$=0.8 142.5 181.0 199.8 225.9 253.0 277.1 ${\alpha _3}$=0.2 421.6 448.8 460.0 541.5 606.6 668.8 ${\alpha _3}$=0.4 388.2 403.5 410.0 442.9 470.0 495.8 ${\alpha _3}$=0.6 238.8 311.6 374.3 388.9 425.7 454.7 ${\alpha _3}$=0.8 211.3 267.3 297.4 329.9 366.5 398.7 ![]() 图 3 部分工况
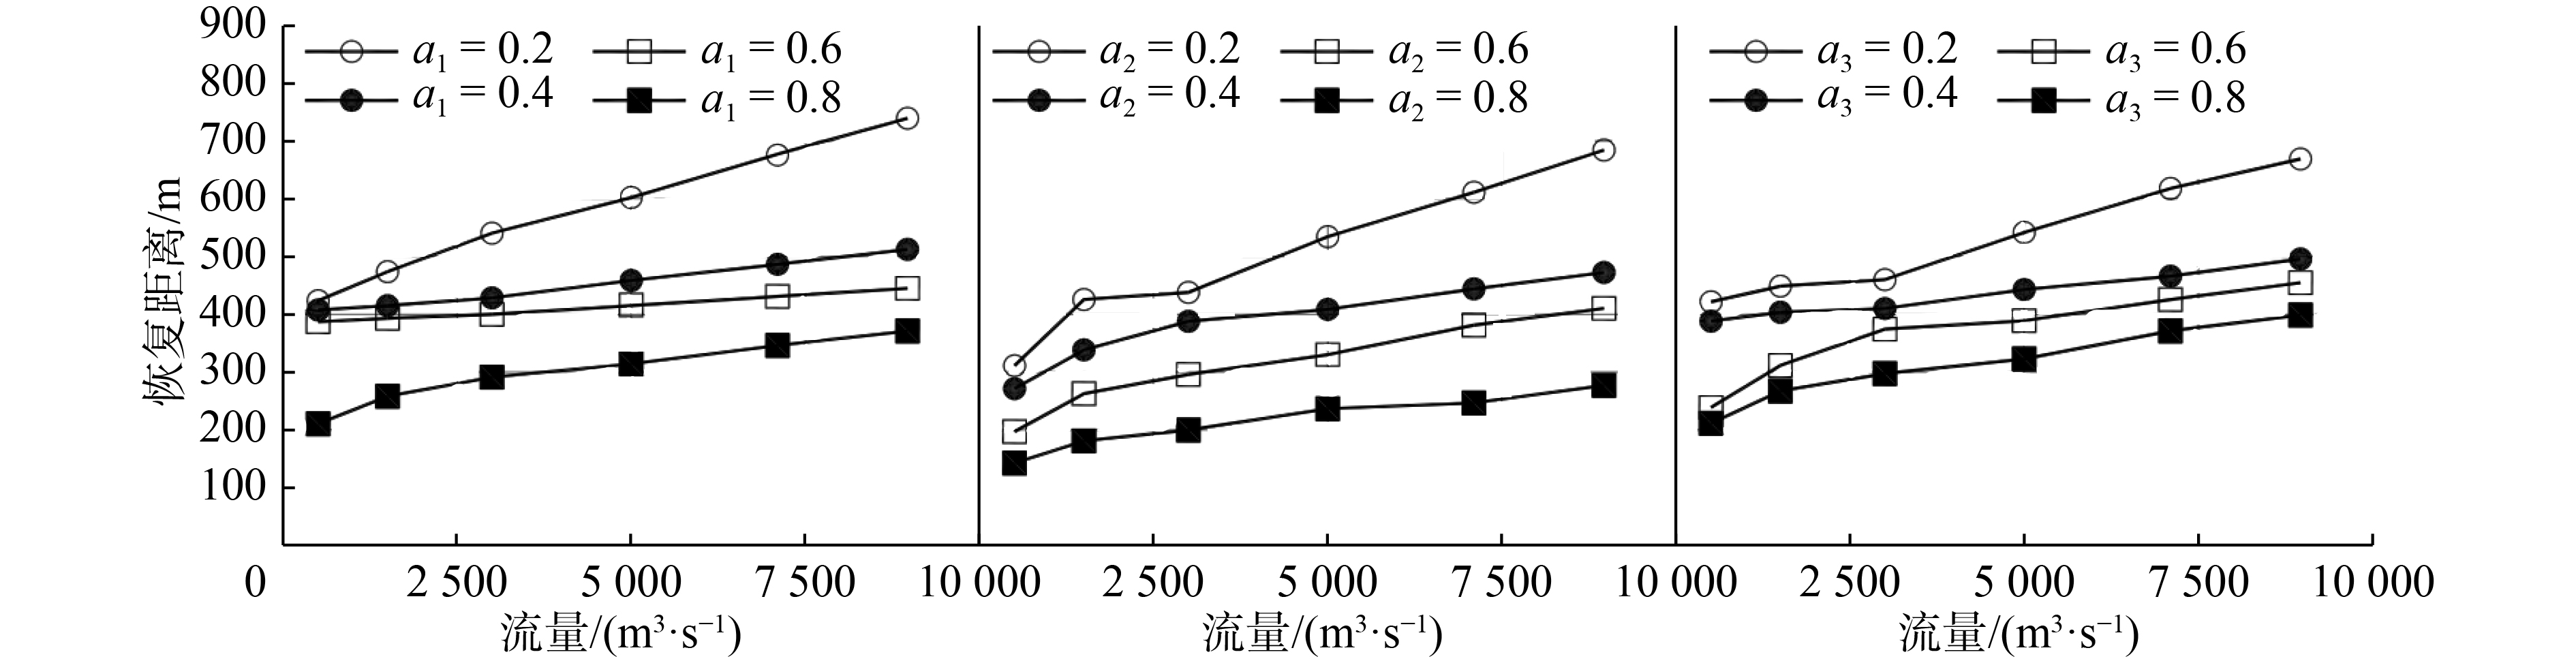
图 3 部分工况$\sigma $ 沿程变化情况(Q=3 000 m3/s)Figure 3.$\sigma $ changes along the river under partial conditions (Q=3 000 m3/s)(1)两端为泄流边界的恢复距离均大于中间为泄流边界的恢复距离,整体比较而言,左端为泄流边界的恢复距离最长,这主要是由于受双侧或单侧扩散以及边界条件的影响。
(2)随着流量增大,动量增强,恢复距离越长,但其变化规律性不强,这主要是由于受天然河流的河床、河岸以及人工建筑边界的影响。
(3)泄流宽度占的比例越大,恢复距离越短,但其变化规律性不强,这与复杂的地下边界可能存在关系。
3.2 全断面泄流工况与极限泄流工况下水流条件对比
前文分析可知,泄流边界
${\alpha _1}$ =0.2时的恢复距离最长,令${\alpha _1}$ =0.2时的工况为极限工况。为了解全断面泄流工况与极限工况在引航道口门区引起的水流条件变化,选用Q=504,1 500,3 000,5 000,7 100和8 967 m3/s共6级流量进行了水流条件对比分析,结果见表3。表 3${\alpha _1}$ =1.0与${\alpha _1}$ =0.2的水流条件对比Table 3. Comparative analysis table of flow conditions as${\alpha _1}$ =1.0 and${\alpha _1}$ =0.2流量/(m3·s−1) 最大纵流/(m·s−1) 最大横流/(m·s−1) 最大回流/(m·s−1) 备注 ${\alpha _1}$=1.0 ${\alpha _1}$=0.2 ${\alpha _1}$=1.0 ${\alpha _1}$=0.2 ${\alpha _1}$=1.0 ${\alpha _1}$=0.2 504 1.18 1.18 0.26 0.26 0.19 0.19 最低通航流量 1 500 1.90 1.90 0.76 0.76 0.89 0.88 3 000 2.45 2.43 0.92 0.90 1.08 0.99 5 000 3.20 2.74 1.18 0.95 1.49 1.20 7 100 3.81 2.95 1.30 1.04 1.86 1.41 最高通航流量 8 967 4.04 4.10 1.30 1.17 2.02 1.66 5年一遇流量 由表2可知,Q=504,1 500,3 000,5 000,7 100和8 967 m3/s时的恢复距离分别为423.6,473.8,540.4,602.2,675.5和739.3 m。由表3可以看出,Q=504,1 500和3 000 m3/s时,
${\alpha _1}$ =1.0和${\alpha _1}$ =0.2工况的最大纵流、最大横流及最大回流是基本一致的,此时的水流恢复距离小于引航道长度,所以无论上游泄流工况如何改变,引航道口门区的通航水流条件都不会受其影响。Q=5 000,7 100和8 967 m3/s时,${\alpha _1}$ =1.0和${\alpha _1}$ =0.2的最大纵流、最大横流及最大回流变化甚为明显,此时的水流恢复距离大于引航道长度,所以上游泄流工况的变化会引起引航道口门区的通航水流条件明显改变。4. 结 语
(1)本文基于平面二维水流数学模型计算了景洪电站不同泄流工况下的水流恢复距离,结果表明,两侧泄流的恢复距离均大于中段泄流的恢复距离,泄流宽度占的比例越大,恢复距离越短,泄流流量越大,恢复距离越长。通过对全断面泄流工况和极限泄流工况在引航道口门区水流条件的对比可知,当水流恢复距离大于引航道长度时,相对应的工况会造成引航道口门区水流条件的明显变化,此时需考虑电站泄流方式对下游通航的影响。
(2)计算工况相较于景洪电站的调度计划而言显得“极限”,这种“极限”体现在与电站的调度运行方式相比泄流边界更为集中,通航水流条件更为复杂,所以电站实际调度运行方式的水流恢复距离比计算工况得出的水流恢复距离要短,对通航的影响也应更微弱。同时本文计算得到的水流恢复距离可为景洪电站的调度运行是否对下游引航道口门区的通航水流条件造成影响提供参考。
-
![]()
图 1 景洪电站枢纽总平面布置(单位:m)
Figure 1. General layout drawing of Jinghong Hydropower Station (unit: m)
![]()
图 2 电站泄流边界处理示意
Figure 2. Diagram of discharge boundary processing of hydropower station
![]()
图 3 部分工况
$\sigma $ 沿程变化情况(Q=3 000 m3/s)Figure 3.
$\sigma $ changes along the river under partial conditions (Q=3 000 m3/s)表 1 电站坝下非全断面泄流恢复距离计算工况
Table 1 Calculation conditions of non-full section discharge recovery distance downstream of hydropower station dam
泄水边界 不泄水边界 流量/(m3·s−1) 备注 ${\alpha _1}$ =1.0${\alpha _2}$ +${\alpha _3}$ =0504/1 500/3 000/5 000/7 100/8 967 无坝全断面泄流 ${\alpha _1}$ =0.2,0.4,0.6,0.8${\alpha _2}$ +${\alpha _3}$ =0.8,0.6,0.4,0.2左段泄流右段不泄流 ${\alpha _2}$ =0.2,0.4,0.6,0.8${\alpha _1}$ +${\alpha _3}$ =0.8,0.6,0.4,0.2中段泄流两侧不泄流 ${\alpha _3}$ =0.2,0.4,0.6,0.8${\alpha _1}$ +${\alpha _2}$ =0.8,0.6,0.4,0.2右段泄流左段不泄流 注: ${\alpha _1}$ =b1/B,${\alpha _2}$ =b2/B,${\alpha _3}$ =b3/B,分别表示左、中、右段泄流宽度占全断面宽度的比例,B=300 m。 下载: 导出CSV
表 2 各工况的恢复距离
Table 2 Recovery distance of each working condition
泄流边界 不同泄流流量下的恢复距离/ m 504 m3/s 1 500 m3/s 3 000 m3/s 5 000 m3/s 7 100 m3/s 8 967 m3/s ${\alpha _1}$ =0.2423.6 473.8 540.4 602.2 675.5 739.3 ${\alpha _1}$ =0.4407.5 415.0 428.4 458.6 486.5 512.4 ${\alpha _1}$ =0.6387.1 393.0 400.0 416.2 431.1 445.0 ${\alpha _1}$ =0.8210.5 258.1 291.3 314.2 344.8 371.1 ${\alpha _2}$ =0.2311.1 425.6 437.9 534.4 611.1 684.2 ${\alpha _2}$ =0.4271.4 338.5 387.9 408.4 443.9 472.4 ${\alpha _2}$ =0.6197.0 262.7 295.9 333.0 374.2 410.3 ${\alpha _2}$ =0.8142.5 181.0 199.8 225.9 253.0 277.1 ${\alpha _3}$ =0.2421.6 448.8 460.0 541.5 606.6 668.8 ${\alpha _3}$ =0.4388.2 403.5 410.0 442.9 470.0 495.8 ${\alpha _3}$ =0.6238.8 311.6 374.3 388.9 425.7 454.7 ${\alpha _3}$ =0.8211.3 267.3 297.4 329.9 366.5 398.7
下载: 导出CSV
表 3
${\alpha _1}$ =1.0与${\alpha _1}$ =0.2的水流条件对比Table 3 Comparative analysis table of flow conditions as
${\alpha _1}$ =1.0 and${\alpha _1}$ =0.2流量/(m3·s−1) 最大纵流/(m·s−1) 最大横流/(m·s−1) 最大回流/(m·s−1) 备注 ${\alpha _1}$ =1.0${\alpha _1}$ =0.2${\alpha _1}$ =1.0${\alpha _1}$ =0.2${\alpha _1}$ =1.0${\alpha _1}$ =0.2504 1.18 1.18 0.26 0.26 0.19 0.19 最低通航流量 1 500 1.90 1.90 0.76 0.76 0.89 0.88 3 000 2.45 2.43 0.92 0.90 1.08 0.99 5 000 3.20 2.74 1.18 0.95 1.49 1.20 7 100 3.81 2.95 1.30 1.04 1.86 1.41 最高通航流量 8 967 4.04 4.10 1.30 1.17 2.02 1.66 5年一遇流量
下载: 导出CSV
-
[1] 胡旭跃, 李彪, 徐立君. 水利枢纽通航水流条件研究综述[J]. 水运工程,2005(11):59-64. (HU Xuyue, LI Biao, XU Lijun. A review of research on navigation flow condition of hydro-junction[J]. Port & Waterway Engineering, 2005(11): 59-64. (in Chinese) doi: 10.3969/j.issn.1002-4972.2005.11.016 [2] 冯小香, 李丹勋, 张明. 枢纽船闸引航道口门区三维水流数值模拟应用研究[J]. 水运工程,2012(1):122-126. (FENG Xiaoxiang, LI Danxun, ZHANG Ming. Application research on 3D flow numerical model in entrance area of ship lock approach channel[J]. Port & Waterway Engineering, 2012(1): 122-126. (in Chinese) doi: 10.3969/j.issn.1002-4972.2012.01.025 [3] 潘雅真, 罗序先, 李穗清, 等. 改变溢流闸孔开启方式来改善船闸引航道口门区的水流条件[J]. 水运工程,1998(7):34-39. (PAN Yazhen, LUO Xuxian, LI Suiqing, et al. Changing the opening mode of spilling gate to improve the flow condition of lock's approach entrance[J]. Port & Waterway Engineering, 1998(7): 34-39. (in Chinese) doi: 10.3969/j.issn.1002-4972.2006.09.013 [4] 吴雪茹. 水利枢纽通航水流条件研究[J]. 水运工程,2006(9):52-55. (WU Xueru. Research on navigation flow condition of hydro-junction[J]. Port & Waterway Engineering, 2006(9): 52-55. (in Chinese) doi: 10.3969/j.issn.1009-640X.2014.02.012 [5] 姜楚, 赵建钧, 辜晋德. 青田水利枢纽通航水流条件试验研究[J]. 水利水运工程学报,2014(2):74-80. (JIANG Chu, ZHAO Jianjun, GU Jinde. Experimental studies on flow condition for navigation of Qingtian hydroproject located at Oujiang River[J]. Hydro-Science and Engineering, 2014(2): 74-80. (in Chinese) [6] 伍志元, 蒋昌波, 陈杰, 等. 泄水闸开启方式对通航水流条件的影响[J]. 水利水电科技进展,2016,36(3):73-77. (WU Zhiyuan, JIANG Changbo, CHEN Jie, et al. Influence of sluice gate opening mode on navigation flow condition[J]. Advances in Science and Technology of Water Resources, 2016, 36(3): 73-77. (in Chinese) doi: 10.3969/j.issn.1009-640X.2012.04.008 [7] 李茜希, 韩昌海, 汪罗. 泄水闸泄流方式对引航道口门区水流的影响[J]. 水电能源科学,2018,36(2):128-131. (LI Qianxi, HAN Changhai, WANG Luo. Influence of entrance area navigation conditions caused by operation mode of sluice gates[J]. Water Resources and Power, 2018, 36(2): 128-131. (in Chinese) doi: 10.3969/j.issn.1002-4972.2004.09.015 [8] 刘亚辉, 李鑫. 澜沧江景洪水电站下引航道口门区通航水流条件试验[J]. 重庆建筑大学学报,2006,28(5):55-62. (LIU Yahui, LI Xin. Study on the navigation flow condition at entrance area of the ship approach channel for Jinghong Power Station on the Lancang River[J]. Journal of Chongqing Jianzhu University, 2006, 28(5): 55-62. (in Chinese) doi: 10.3880/j.issn.1006-7647.2010.06.011 [9] 韩昌海, 杨宇, 余之光. 多汊河流航电枢纽航线规划及通航水流条件[J]. 水利水运工程学报,2012(4):39-43. (HAN Changhai, YANG Yu, YU Zhiguang. A study of the route planning and navigation flow condition of navigation-hydropower project at multi-branch river[J]. Hydro-Science and Engineering, 2012(4): 39-43. (in Chinese) doi: 10.3880/j.issn.1006-7647.2009.01.010 [10] 刘亚辉, 张绪进. 低坝枢纽泄洪闸布置对引航道口门区通航条件的影响[J]. 水运工程,2004(9):59-62. (LIU Yahui, ZHANG Xujin. Influence of layout of flood-relief sluice in low-head hydrojunction on navigation condition at the entrance area of approach channel[J]. Port & Waterway Engineering, 2004(9): 59-62. (in Chinese) [11] 姚仕明, 王兴奎, 张丙印. 三峡大坝至葛洲坝两坝间河段通航水流条件[J]. 水利水电科技进展,2010,30(6):43-47. (YAO Shiming, WANG Xingkui, ZHANG Bingyin. Navigable flow conditions of river reach between Three Gorges Dam and Gezhouba Dam[J]. Advances in Science and Technology of Water Resources, 2010, 30(6): 43-47. (in Chinese) [12] 崔冬, 刘新成, 潘丽红. 一、二维耦合数学模型在水利枢纽通航水流条件研究中的应用[J]. 水利水电科技进展,2009,29(1):35-39. (CUI Dong, LIU Xincheng, PAN Lihong. Application of 1D and 2D coupled mathematical model in navigation flow condition of hydro-junction[J]. Advances in Science and Technology of Water Resources, 2009, 29(1): 35-39. (in Chinese) [13] 中华人民共和国住房和城乡建设部. 内河通航标准: GB 50139—2014 [S]. 北京: 中国计划出版社, 2015. Ministry of Housing and Urban-Rural Development of the People's Republic of China. Navigation standard of inland waterway: GB 50139—2014[S]. Beijing: China Planning Press, 2015.(in Chinese)


计量
- 文章访问数: 388
- HTML全文浏览量: 173
- PDF下载量: 27
