
 Email Alerts
 RSS
RSS
Study on the response of different moving speeds on storm surge in Zhejiang coastal waters
-
摘要:
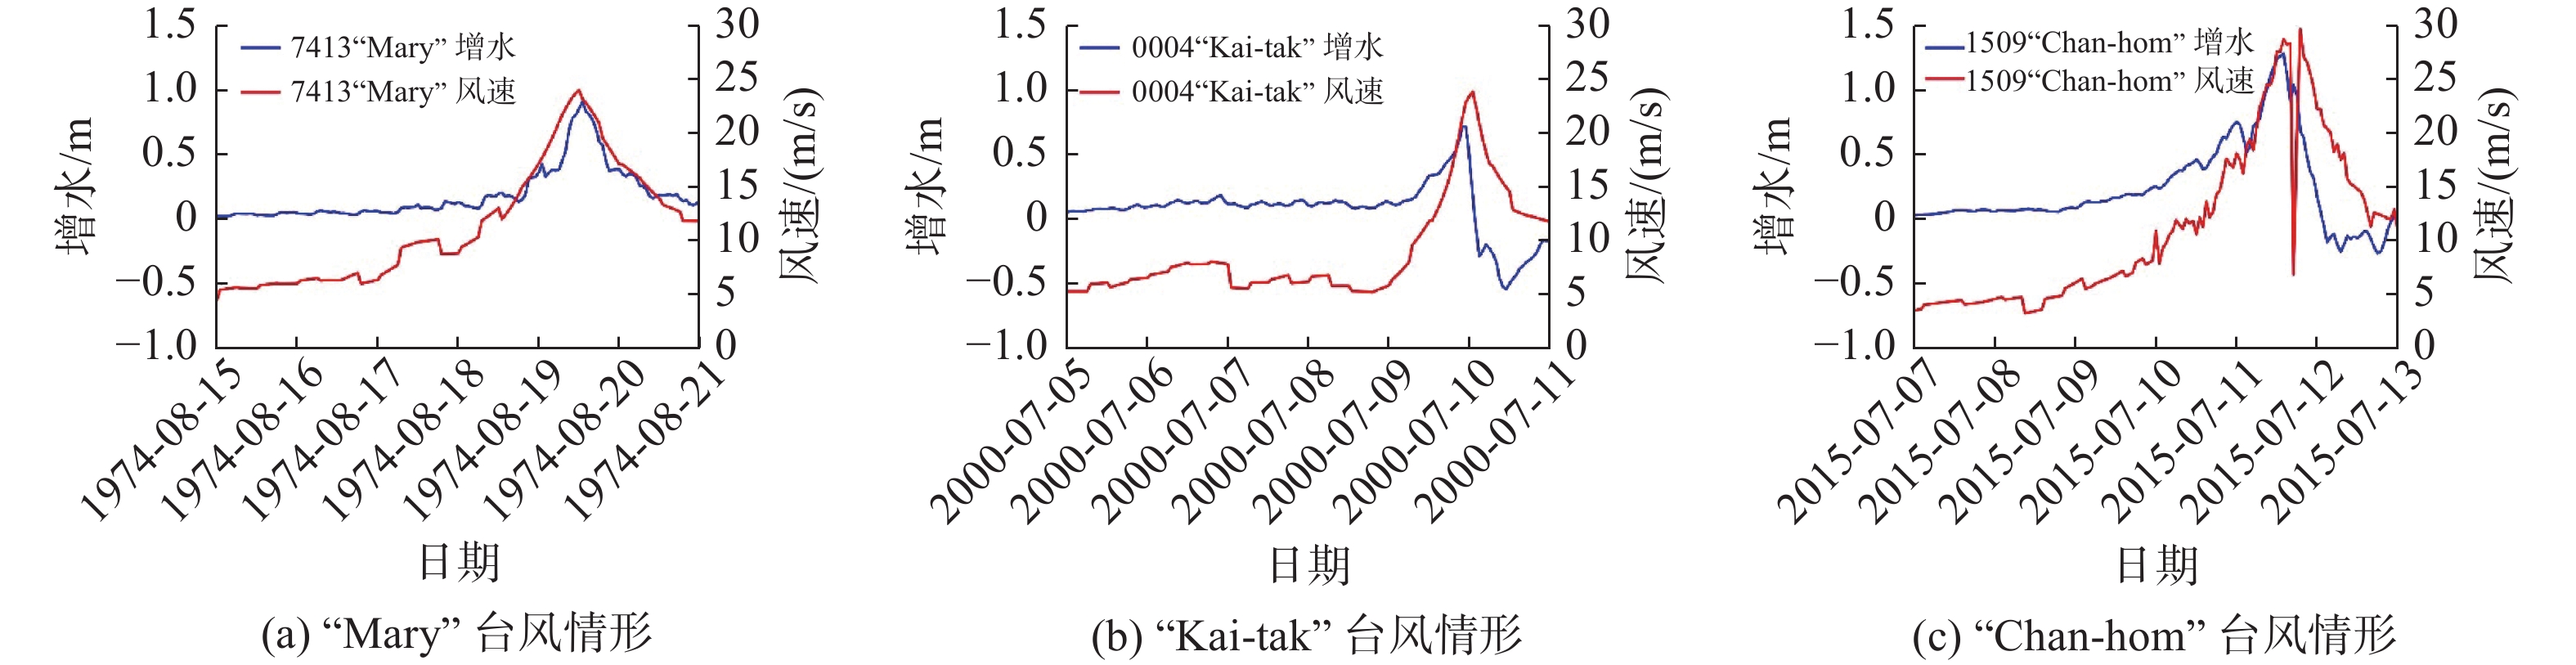
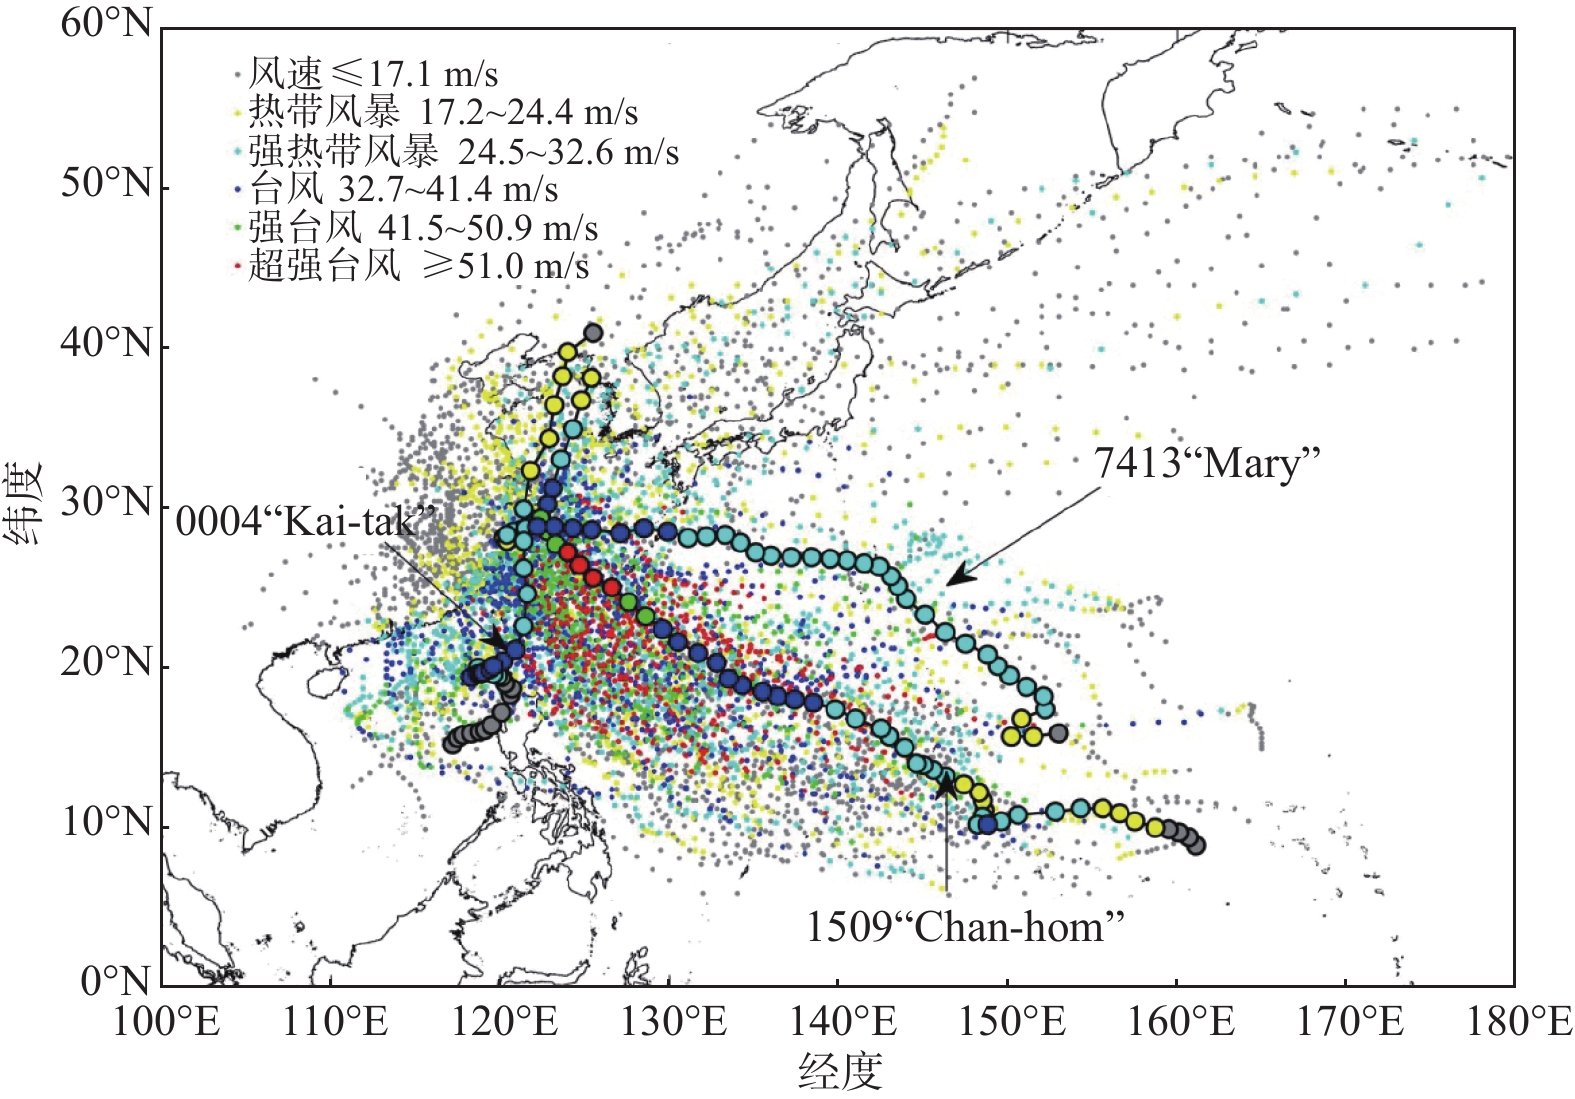
基于MIKE21建立东中国海-浙江沿海嵌套潮流模型,采用修正的Holland风场对1509号台风“Chan-hom”产生的风暴潮进行模拟,通过与实测数据对比验证表明该模型模拟结果合理可靠。基于验证模型,对1949—2020年间2个极端移速台风(低移速台风“Mary”和高移速台风“Kai-tak”)进行模拟分析,为剥离单一移速变量对增水的影响,以1509号台风“Chan-hom”为基础,设置3种台风移速(2倍移速、实际移速及50%移速)对风暴潮增水影响进行研究,得到如下结论:(1)低移速台风尽管登陆时强度低于高移速台风,但对浙江沿海海域的增水影响时间更长,台风“Kai-tak”增水0.5 m及以上的持续时间仅4 h,而“Mary”却长达12 h;(2)台风移速越慢,向岸风影响时间越长,舟山群岛以西至钱塘江海域的增水随着移速的减小呈上升趋势,杭州湾南岸具有较大洪水及内涝隐患;(3)在台风登陆点朱家尖,3种移速下的增水及风速相差不大,最大增水出现在台风登陆前风速最大时刻,而在舟山外海,增水大小受潮位波动影响呈现周期变化,低潮位时增水较大,高潮位时增水较小。
Abstract:A nested tidal model for the East China Sea-Zhejiang coastal waters is built by use of MIKE21, to simulate the storm surge generated by typhoon “Chan-hom” based on Holland wind field model. The comparison of the numerical results and the field measurements shows that the simulated values are reasonable and reliable. Based on the verified model, two typhoons with extreme moving speeds (typhoon “Mary” and “Kai-tak” with low and high moving speeds, respectively) from 1949 to 2020 are simulated and analyzed. To investigate the influence of the moving speed, three different moving speeds (2.0, 1.0 and 0.5 times of the actual moving speed) are studied based on the typhoon case “Chan-hom”. The results show that (1) for the two typhoons with extreme moving speeds, although the landing intensity of low moving speed typhoon is lower than that of high moving speed typhoon, the former has a longer impact on the storm surge in the coastal waters of Zhejiang Province for low moving speed typhoon. The duration of 0.5 m or above water level increase is only 4 h for “Kai-tak”, while for “Mary” the duration of the same water level increase is 12 h. (2) for the three different moving speeds, when the moving speed is slower, the wind direction points to the shore for a longer time, which makes the water level in the area from the west of Zhoushan sea area to the Qiantang River increase due to the decrease of the moving speed. (3) The field data from Zhujiajian observing point shows that the maximum increase of the water level appears as the wind speed reaches the maximum value before landing. There is little difference in the water level increase under the three different moving speeds. At the Zhoushan offshore observing point, the water level changes periodically with the tide level. The water increase is larger at the low tide level, while it is smaller at the high tide level.
-
Keywords:
- storm surge /
- moving speed /
- Holland wind field /
- MIKE21 /
- typhoon
-
近年来随着我国经济的发展,跨海桥梁的建设规模取得了突飞猛进的增长。如我国已建成的港珠澳大桥、杭州湾跨海大桥、胶州湾大桥等。在复杂的海洋水动力条件下,跨海桥梁的桥墩基础局部海床受到三维绕流影响而发生剧烈冲刷[1],导致桥墩基础裸露过多,降低了桥墩基础的承载能力,严重的则会导致桥梁冲刷破坏。国内外学者调查了一些桥梁损坏原因后发现,桥梁基础冲刷是导致桥墩损毁的主要原因之一。对于桥梁基础冲刷问题,目前相关学者对其进行了系统深入的研究与探索[2-6],采用的方法普遍是室内物理模型试验和数值模拟方法。但大部分研究主要集中于简单水流波浪条件或者简化桥墩。而在实际工程中,桥墩基础样式和潮流动力条件均较为复杂,且因部分大桥附属结构叠加影响,实际情况下跨海桥梁基础冲刷特征[7]与传统的室内试验或数模研究成果差别较大。如横跨杭州湾海域的杭州湾跨海大桥(图1),在南通航孔以南2 km位置桥轴线下游侧有一座海中观光平台,配有4座匝道,海中平台区上游的匝道下部墩群、大桥主墩及海中平台下部结构形成了复杂的墩群结构[8-9]。在其影响下,基础冲刷问题比较突出。鉴于此,本文拟基于多年的海中平台区实测资料,通过对比统计历年地形资料分析海中平台区海床冲刷规律,结合数值模拟结果,揭示复杂墩群结构下的冲刷机理,为杭州湾跨海大桥的桥墩冲刷评估提供技术支撑。
1. 工程概况及水文泥沙特征
1.1 项目概况
杭州湾跨海大桥北起嘉兴市海盐县郑家埭,南止于宁波市慈溪市丰收闸,正桥长度达36 km,共600余跨,大桥于2008年5月1日正式通车运行,杭州湾跨海大桥海中平台位于大桥下游南航道桥以南位置,海中平台呈椭圆形,长轴长147.8 m,短轴长99.0 m,采用桩柱一体+梁板结构。海中平台基础采用直径为1.6 m的钢管桩+填芯混凝土结构。海中平台下游40 m 为观光塔,观光塔基础采用高桩承台。海中平台南侧码头平台尺度62.0 m×10.2 m,采用高桩梁板结构。海中平台与B、C、D、E4座匝道桥形成了海中的互通立交系统。匝道桥下部构造均采用桩柱体结构,桩基础采用直径2.0 m的钻孔摩擦桩,上接直径1.8 m的圆柱墩身[9],匝道墩最大跨径21 m(图2)。
1.2 潮 流
工程海域潮流呈往复流[10],流向基本与等深线走向一致。整体上涨潮流速大于落潮流速,但涨潮历时要小于落潮历时,涨潮历时约5.28 h,落潮历时6.57 h。根据杭州湾跨海大桥北通航孔、中引桥、海中平台及庵东边滩4个位置多年潮流测验资料,各垂线平均最大涨潮流速1.74~3.30 m/s,垂线平均最大落潮流速1.67~2.45 m/s。空间分布上,自北向南潮流逐渐增强,位于北通航孔区的流速相对较小,涨、落潮垂线平均最大流速分别为1.74和1.67 m/s,位于庵东边滩坡脚处的流速最大,涨、落潮垂线平均最大流速分别达3.30和2.45 m/s。海中平台附近的流速亦较大,其涨、落潮垂线平均最大流速分别达2.72和2.11 m/s,涨潮流流速占优势。
1.3 海床底质
地质勘查资料表明,杭州湾跨海大桥所在区域海床主要由亚砂土层和淤泥质亚黏土层构成。其中亚砂土层平均层底高程为−17.3 m,饱和,局部含贝壳碎片、夹少量黏性土,天然含水量31%(平均值,下同),密度为1.91 g/cm3,天然孔隙比0.86,水下休止角30°,经颗粒分析可知其粒径在0.005~0.100 mm范围内的占81.1%。淤泥质亚黏土层平均层底高程为−36.8 m,属高压缩性土,夹亚砂土、粉砂薄层,天然含水量39%,密度为1.80 g/cm3,天然孔隙比1.09,其粒径在0.005~0.100 mm范围内的约占84.1%,与亚砂土层接近,仅黏性含量稍高一些,该河段河床质较为均匀一致,其平均中值粒径约0.049 mm,根据张瑞瑾细颗粒泥沙起动公式计算,大桥所在海域河床泥沙起动流速为0.7~1.0 m/s(水深10~20 m)。
2. 海中平台区局部水动力特征
2.1 模型构造
海床冲刷与水动力特征密切相关[11],为探究海中平台区海床冲刷机理,首先应用三维CFD数值模型FLUENT软件对海中平台及匝道墩局部区域进行了概化模拟计算。模型中将海中平台、主墩、匝道墩均进行了刻画,取建桥前的海床平均地形及相应的平均高潮位以下水深。考虑到该区域涨潮流占优且实测地形资料也表明各墩冲刷坑呈涨潮流占优形态[12],选用实测最大涨急垂向平均流速2.72 m/s,进行海中平台及匝道墩局部涨潮期的模拟计算。模型水流方向长4 000 m、宽2 000 m、水深11 m,采用非结构化网格进行离散,总网格数180万。模型下游侧为流速边界,上游侧为自由出流边界,底部边界设置为壁面边界,其他边界均设置为Symmtery边界。
2.2 流速分布规律
图3为平均水深位置及其流速分布,可以看出,在海中平台北侧及南侧码头位置流速普遍较大,最大流速约4 m/s,而在海中平台上游侧因处于隐蔽区,其流速普遍较小,部分区域流速在1 m/s以内。对于南侧匝道墩ZD系列匝道墩,可以看出ZD系列匝道墩前沿流速普遍与来流流速接近(图4(a)),仅ZD11墩附近流速较大。ZD17~ZD22墩流速普遍较小。对于ZD系列墩上游的ZB系列匝道墩,受主墩及ZD系列匝道墩绕流影响,ZB系列匝道墩的前沿流速要稍大,特别是ZB~ZB22墩区域,ZB1~ZB7墩流速相对稍小些。
北侧下游ZE系列匝道墩ZE1~ZE3匝道墩位于海中平台掩护区(图4(b)),流速普遍较小,ZE4~ZE14匝道墩受海中平台绕流影响,墩前流速稍大。ZE15~ZE22墩因远离海中平台,绕流影响减弱,墩前流速稍小。上游ZC系列匝道墩,特别是ZC1~ZC14墩,受下游侧海中平台绕流及主墩绕流影响,其墩前流速普遍大于ZE墩前流速。而ZC15~ZC22墩则因处于海中平台掩护区,流速较小。
3. 海中平台区海床冲淤
自大桥建成以来,每年均进行了大桥重点桥墩及海中平台区桥墩冲刷地形的跟踪观测。应用建桥前2001年及建桥后2012—2019年的水下地形资料对海中平台区海床冲淤情况进行分析。
对于海中平台区的测量,为全方位了解海床情况,设定了矩形测量区域:即桥轴线上下游各1 km、海中平台东西向中心线的南北两侧各500 m。测量范围涵盖了海中平台、上游主桥墩及4座匝道墩[6]。测量设备采用美国R2Sonic公司Sonic 2024多波束测深系统进行全覆盖测量。为保证定位精度,多波束水下地形测量采用基于ZJCORS的网络RTK技术进行导航定位。多波束水下地形测量使用QINSy软件进行导航和数据采集。首先由Applanix POS MV Elite组合导航系统输出定位、姿态及航向数据给多波束测深系统和数据采集系统,同时将多波束测深系统获取的水下地形地貌数据提供给数据采集系统,并根据POS MV提供的1PPS秒脉冲信号进行时间同步并由QINSy软件记录所有的数据,用于后续处理。为了尽可能捕捉到每年的最低冲刷高程,水下地形观测时间均安排在每年的9月大潮期。
3.1 海床地形面貌特征
海中平台区域2012年以来历年实测地形如图5所示。
![]() 图 5 海中平台局部海床地形变化(2012—2019年)Figure 5. Topographic change around platform area (2012—2019)
图 5 海中平台局部海床地形变化(2012—2019年)Figure 5. Topographic change around platform area (2012—2019)可见,由于海中平台及其前端观光塔塔基的阻水,对水流特别是涨潮流造成挤压[12],南北两侧的水流得到加强,海中平台两侧形成条带状冲刷槽,冲刷槽向上游延伸,呈明显涨潮流占优的冲刷坑。对比2012—2019年以来各测次海中平台附近海床地形图可见,海中平台两侧冲刷槽形成的−20 m 等高线于2015年与主墩及匝道墩区的−20 m等高线贯通,其后基本保持贯通状态。对于−22 m等高线,北侧自2013年的66 m 延长到了144 m,而南侧从25 m 发展到了245 m。−23 m等高线在2015年首先形成于南侧码头前沿,长度约18 m,其后码头形成的局部冲刷坑自2015年以来有逐年加深和扩大趋势,可能与涨潮流增强有关。从图5中还可以看出,大桥部分主墩及匝道墩位于南北两侧冲刷槽内,导致部分主墩及匝道墩局部河床高程普遍在−20 m 以下,明显低于周边海床高程。对于海中平台上游侧隐蔽区,特别是ZB和ZC系列匝道墩交汇区域,由于海中平台的掩护作用,海床高程普遍高于两侧冲刷槽海床高程。
3.2 海床冲淤变化
建桥后,受桥梁基础的绕流冲刷影响,跨海大桥附近海床将会发生剧烈冲刷,为比较直观了解海中平台区大桥建设对海床冲刷的影响,应用2001年建桥前该区域水下地形测量资料及2012年、2019年建桥后海床地形资料进行冲淤变化分析。图6(a)为2001—2012年间的海床冲淤图,可见,建桥后大桥上游侧500 m以外区域海床整体淤积,这与大桥所在的澉浦-乍浦海域以往整体淤积的趋势是一致的。但在大桥近区,受跨海大桥整体阻水影响,桥轴线上下游约500 m范围内海床普遍冲刷1 m以上,其中海中平台两侧受局部绕流冲刷影响冲刷幅度较大,最大冲刷幅度可达14 m以上。海中平台上游的部分主墩与匝道墩区域海床也因局部绕流冲刷影响而刷深较多。
以上通过建桥前后地形对比分析了海中平台区大桥建设引起的一般冲刷及局部冲刷影响情况,而建桥后海中平台区海床冲淤变化因大桥的局部冲刷及一般冲刷基本趋于稳定[8],其海床冲淤逐渐受到宏观海床冲淤的影响。图6(b)为2012—2019年海中平台区的海床冲淤变化情况。总体而言,建桥引起的一般冲刷及局部冲刷影响基本很小,海中平台附近海床整体呈淤积趋势,平均淤积幅度超过1 m,这主要受整个河段宏观淤积的影响。但在局部区域受海中平台、主墩等局部建筑物的绕流冲刷影响,2012—2019年期间仍呈现冲刷加剧趋势,特别是海中平台南侧码头前沿位置,但其最大冲刷幅度在3 m以内,要远小于2001—2012年的冲刷幅度。
3.3 匝道墩最低高程统计
由前述分析可知,海中平台区部分匝道墩位于冲刷槽内,海床高程较低,且因海中平台区匝道墩为单桩独柱结构,桥墩的冲刷对匝道墩的结构稳定影响较大,因此桥梁管理部门十分重视各匝道墩附近的河床最低高程。根据几次测量资料[7],统计各墩历史最低高程见图7。对于位于桥轴线下游的ZD、ZE系列匝道墩,直接受到海中平台绕流冲刷的影响,海床高程略低,ZD系列匝道墩的ZD1-ZD17墩海床高程基本为−22~−23 m,而ZD18-ZD22墩的最低海床高程则因位于海中平台的隐蔽区而略高。ZE系列匝道墩中间区域即位于海中平台冲刷槽内的匝道墩的海床高程较低,其中ZE10-ZD13的最低高程低于−24 m,越往两侧匝道墩海床高程略有抬高。
![]() 图 7 各系列匝道墩历史最低高程统计Figure 7. Statistical chart of lowest elevation for each series of ramp piers
图 7 各系列匝道墩历史最低高程统计Figure 7. Statistical chart of lowest elevation for each series of ramp piers对于桥轴线上游的ZB和ZC系列匝道墩,受到海中平台及大桥主墩绕流冲刷叠加影响。ZB和ZC系列匝道墩的海床高程整体来说要比下游侧ZD和ZE系列匝道墩海床高程低。ZB系列墩ZB8~ZB22墩海床高程普遍在−23 m以下,其中位于主墩之间区域的ZB14墩海床高程低至−25 m以下。ZC系列匝道墩ZC1~ZC14墩的海床高程也是普遍在−23 m以下,其中ZC8~ZC14海床高程均低于−24 m,最低至−26 m(ZC8)。
3.4 匝道墩最低高程与潮流动力相关性
各匝道墩最低高程与所在墩前流速密切相关,根据前述流速分布情况,提取了各匝道墩的前沿流速,并将其与各墩历史最低高程进行了相关性分析,图8为两者的相关关系图,可以看出基本呈现墩前流速越大,冲刷深度越大,相应的最低高程越低的规律。相比建桥前匝道墩的冲刷深度普遍在6~14 m,其冲刷深度约为匝道墩直径的3~7倍,远大于以往学者认为的桥墩局部冲刷深度最大约为2.0倍的桥墩阻流尺度。这说明对匝道墩来说,海中平台较强的局部冲刷效应掩盖了匝道墩自身的局部冲刷效应,是导致各匝道墩最低高程的主要因素[12]。而近年来,随着杭州湾南岸围垦工程的实施,大桥海域潮流动力有逐年增强趋势,这势必会进一步加剧海中平台区的桥墩冲刷,需引起关注。
4. 结 语
(1)针对杭州湾跨海大桥海中平台区的宏观冲刷及局部冲刷特征,利用建桥前后的水下地形资料对比分析了海中平台区建桥引起的一般冲刷及局部冲刷幅度,并分析了海中平台区海床冲淤发展趋势,为未来的桥墩冲刷评估提供了支撑。
(2)受海中平台阻流影响,海中平台南北两侧形成向上游延伸的局部冲刷槽,这是引起平台上游侧匝道墩海床高程普遍较低的主要原因。除此之外,位于桥轴线上游的匝道墩还受到主墩绕流冲刷影响,导致桥轴线上游侧匝道墩最低海床高程普遍要低于桥轴线下游侧匝道墩最低海床高程。
(3)各匝道墩最低海床高程与水流流速密切相关,受海中平台阻流影响,平台两侧流速增大,同时各主墩之间流速也有所增大,进而导致各流速增大区内的匝道墩冲刷幅度较大,历史最低海床高程较低,而海中平台的背流区流速较小,匝道墩的冲刷高程也较高。
-
![]()
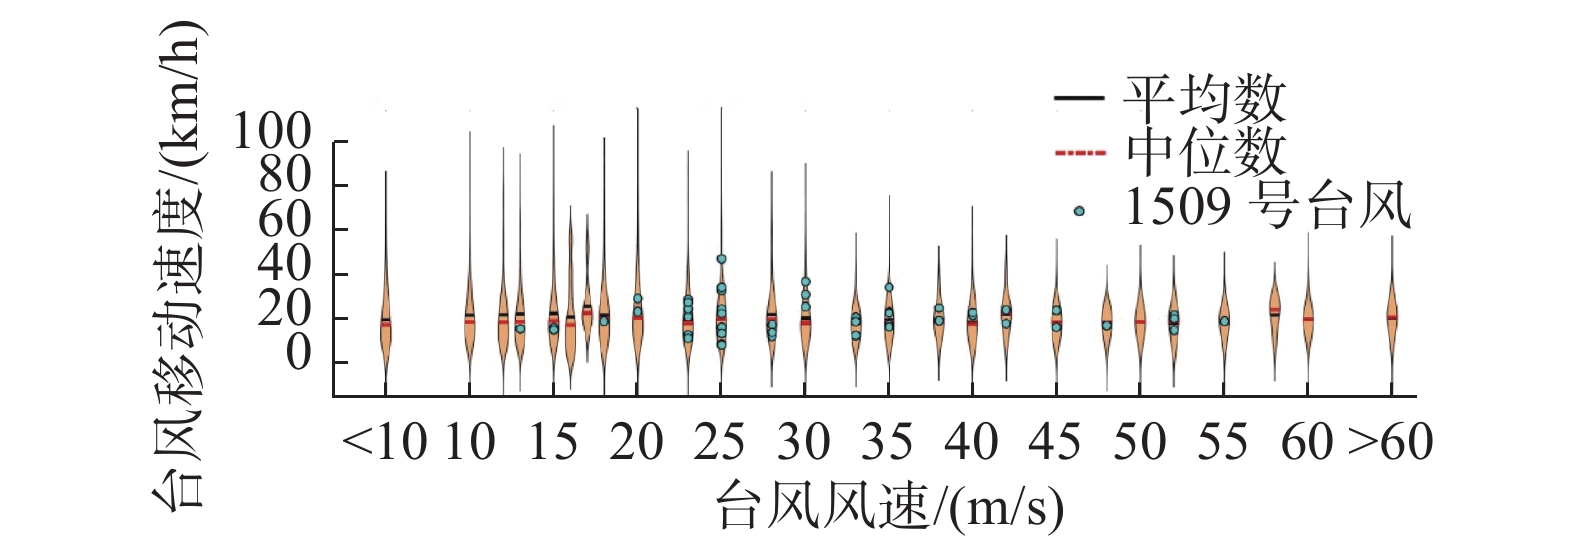
图 2 不同风速对应的台风移速
Figure 2. Different wind speeds corresponding to the moving speed of the typhoon
![]()
图 5 典型移速台风事件下增水及风速过程
Figure 5. Surge and wind speed timeseries under typical typhoon events
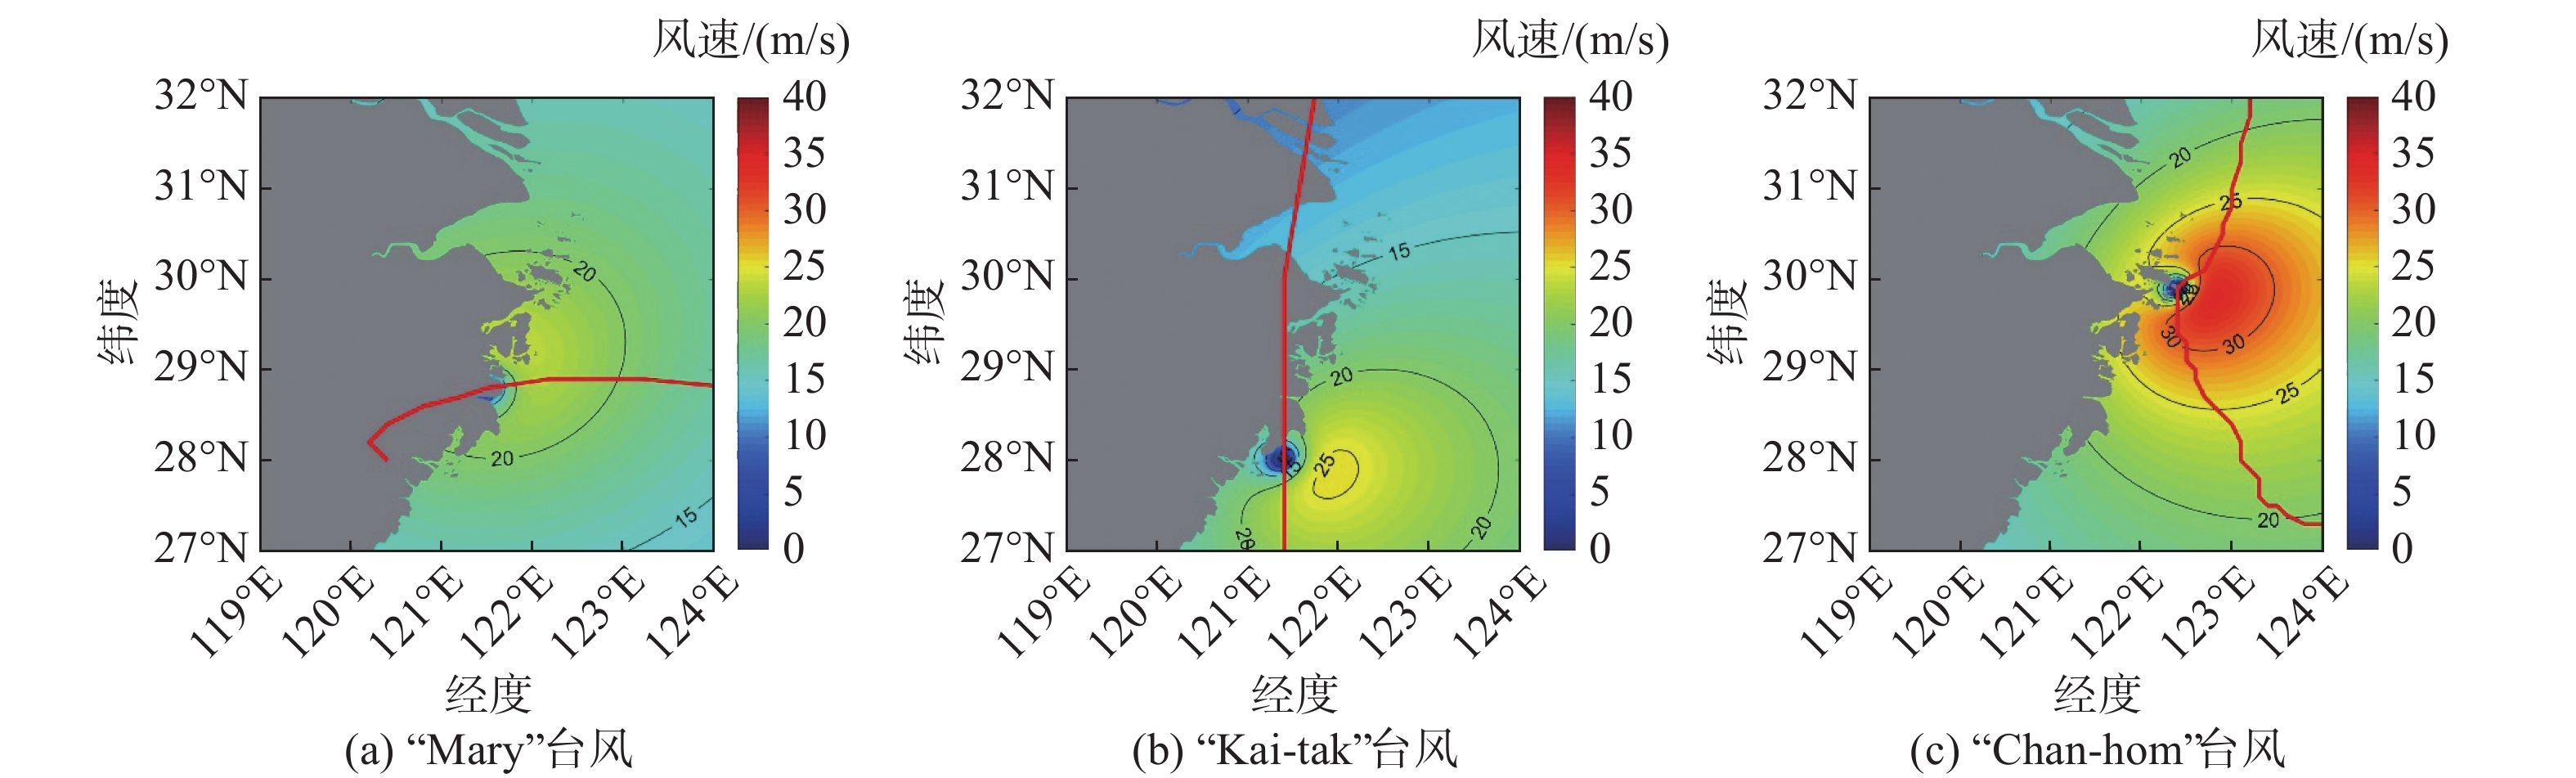
![]()
图 7 台风登陆前后增水平面分布
Figure 7. Horizontal distribution of surges and winds before and after the typhoon landfall
![]()
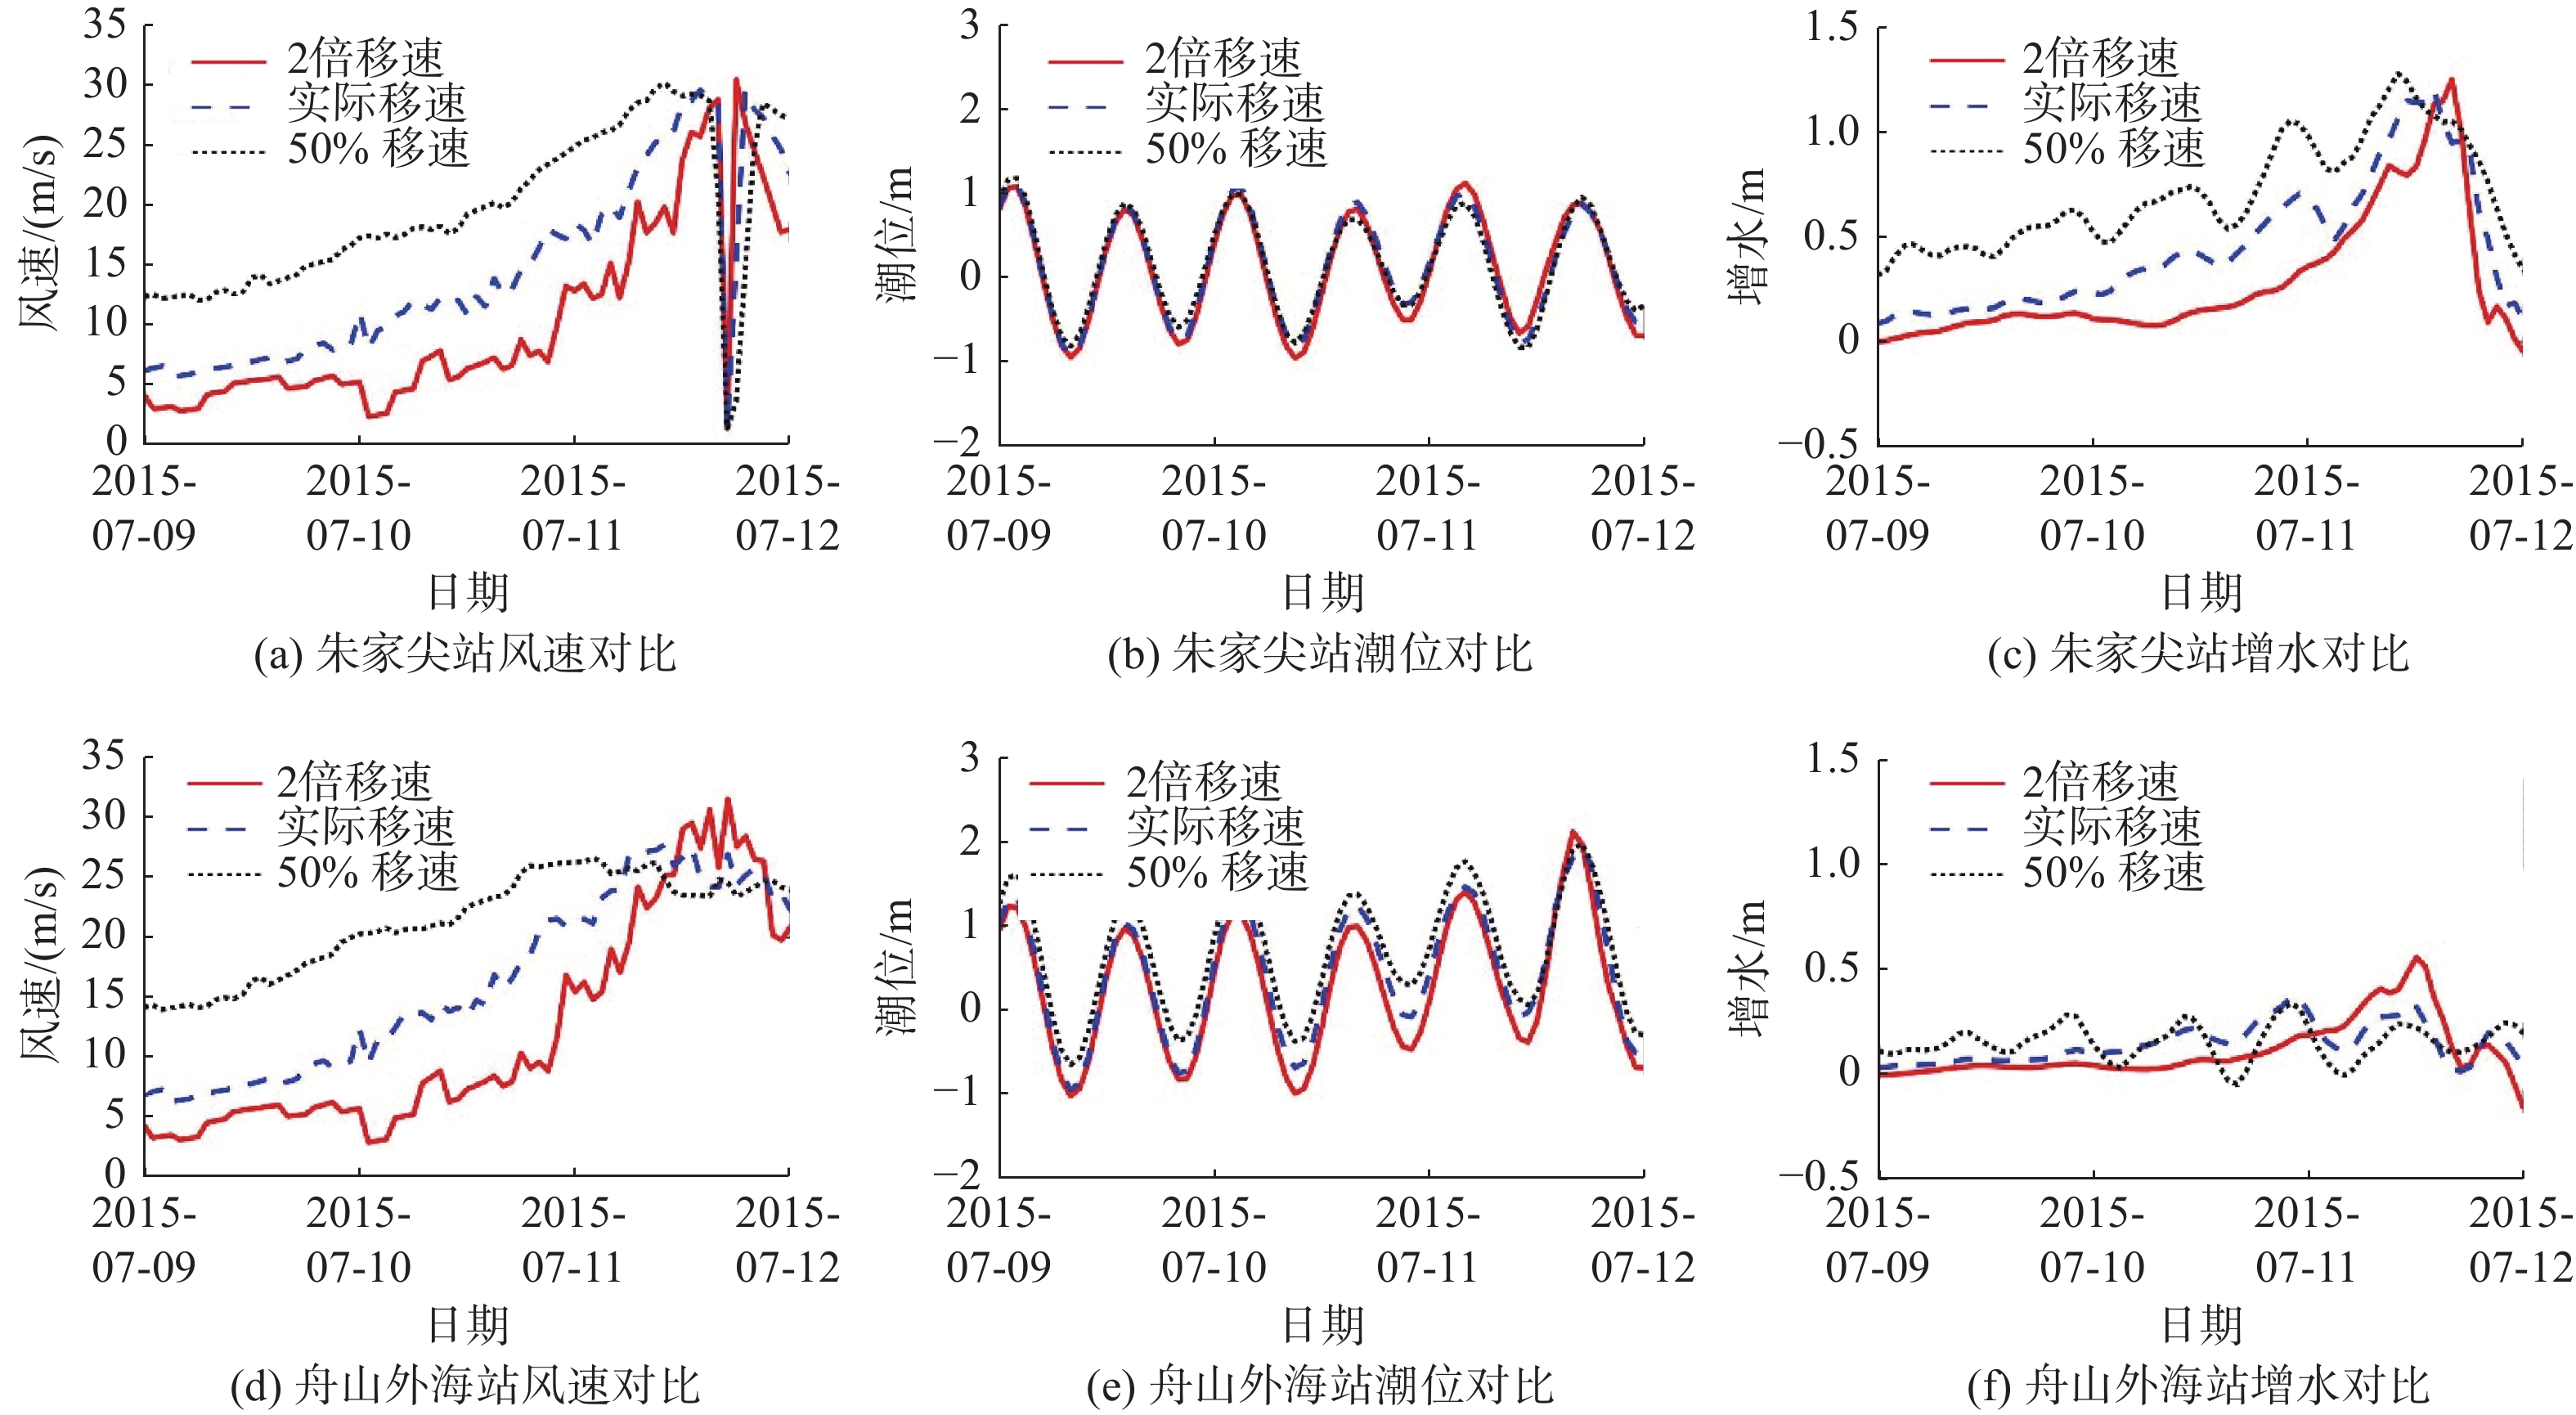
图 8 不同台风移速情景下风速、潮位及增水对比
Figure 8. Comparisons of wind speed, tide level and surge in different typhoon moving speed scenarios
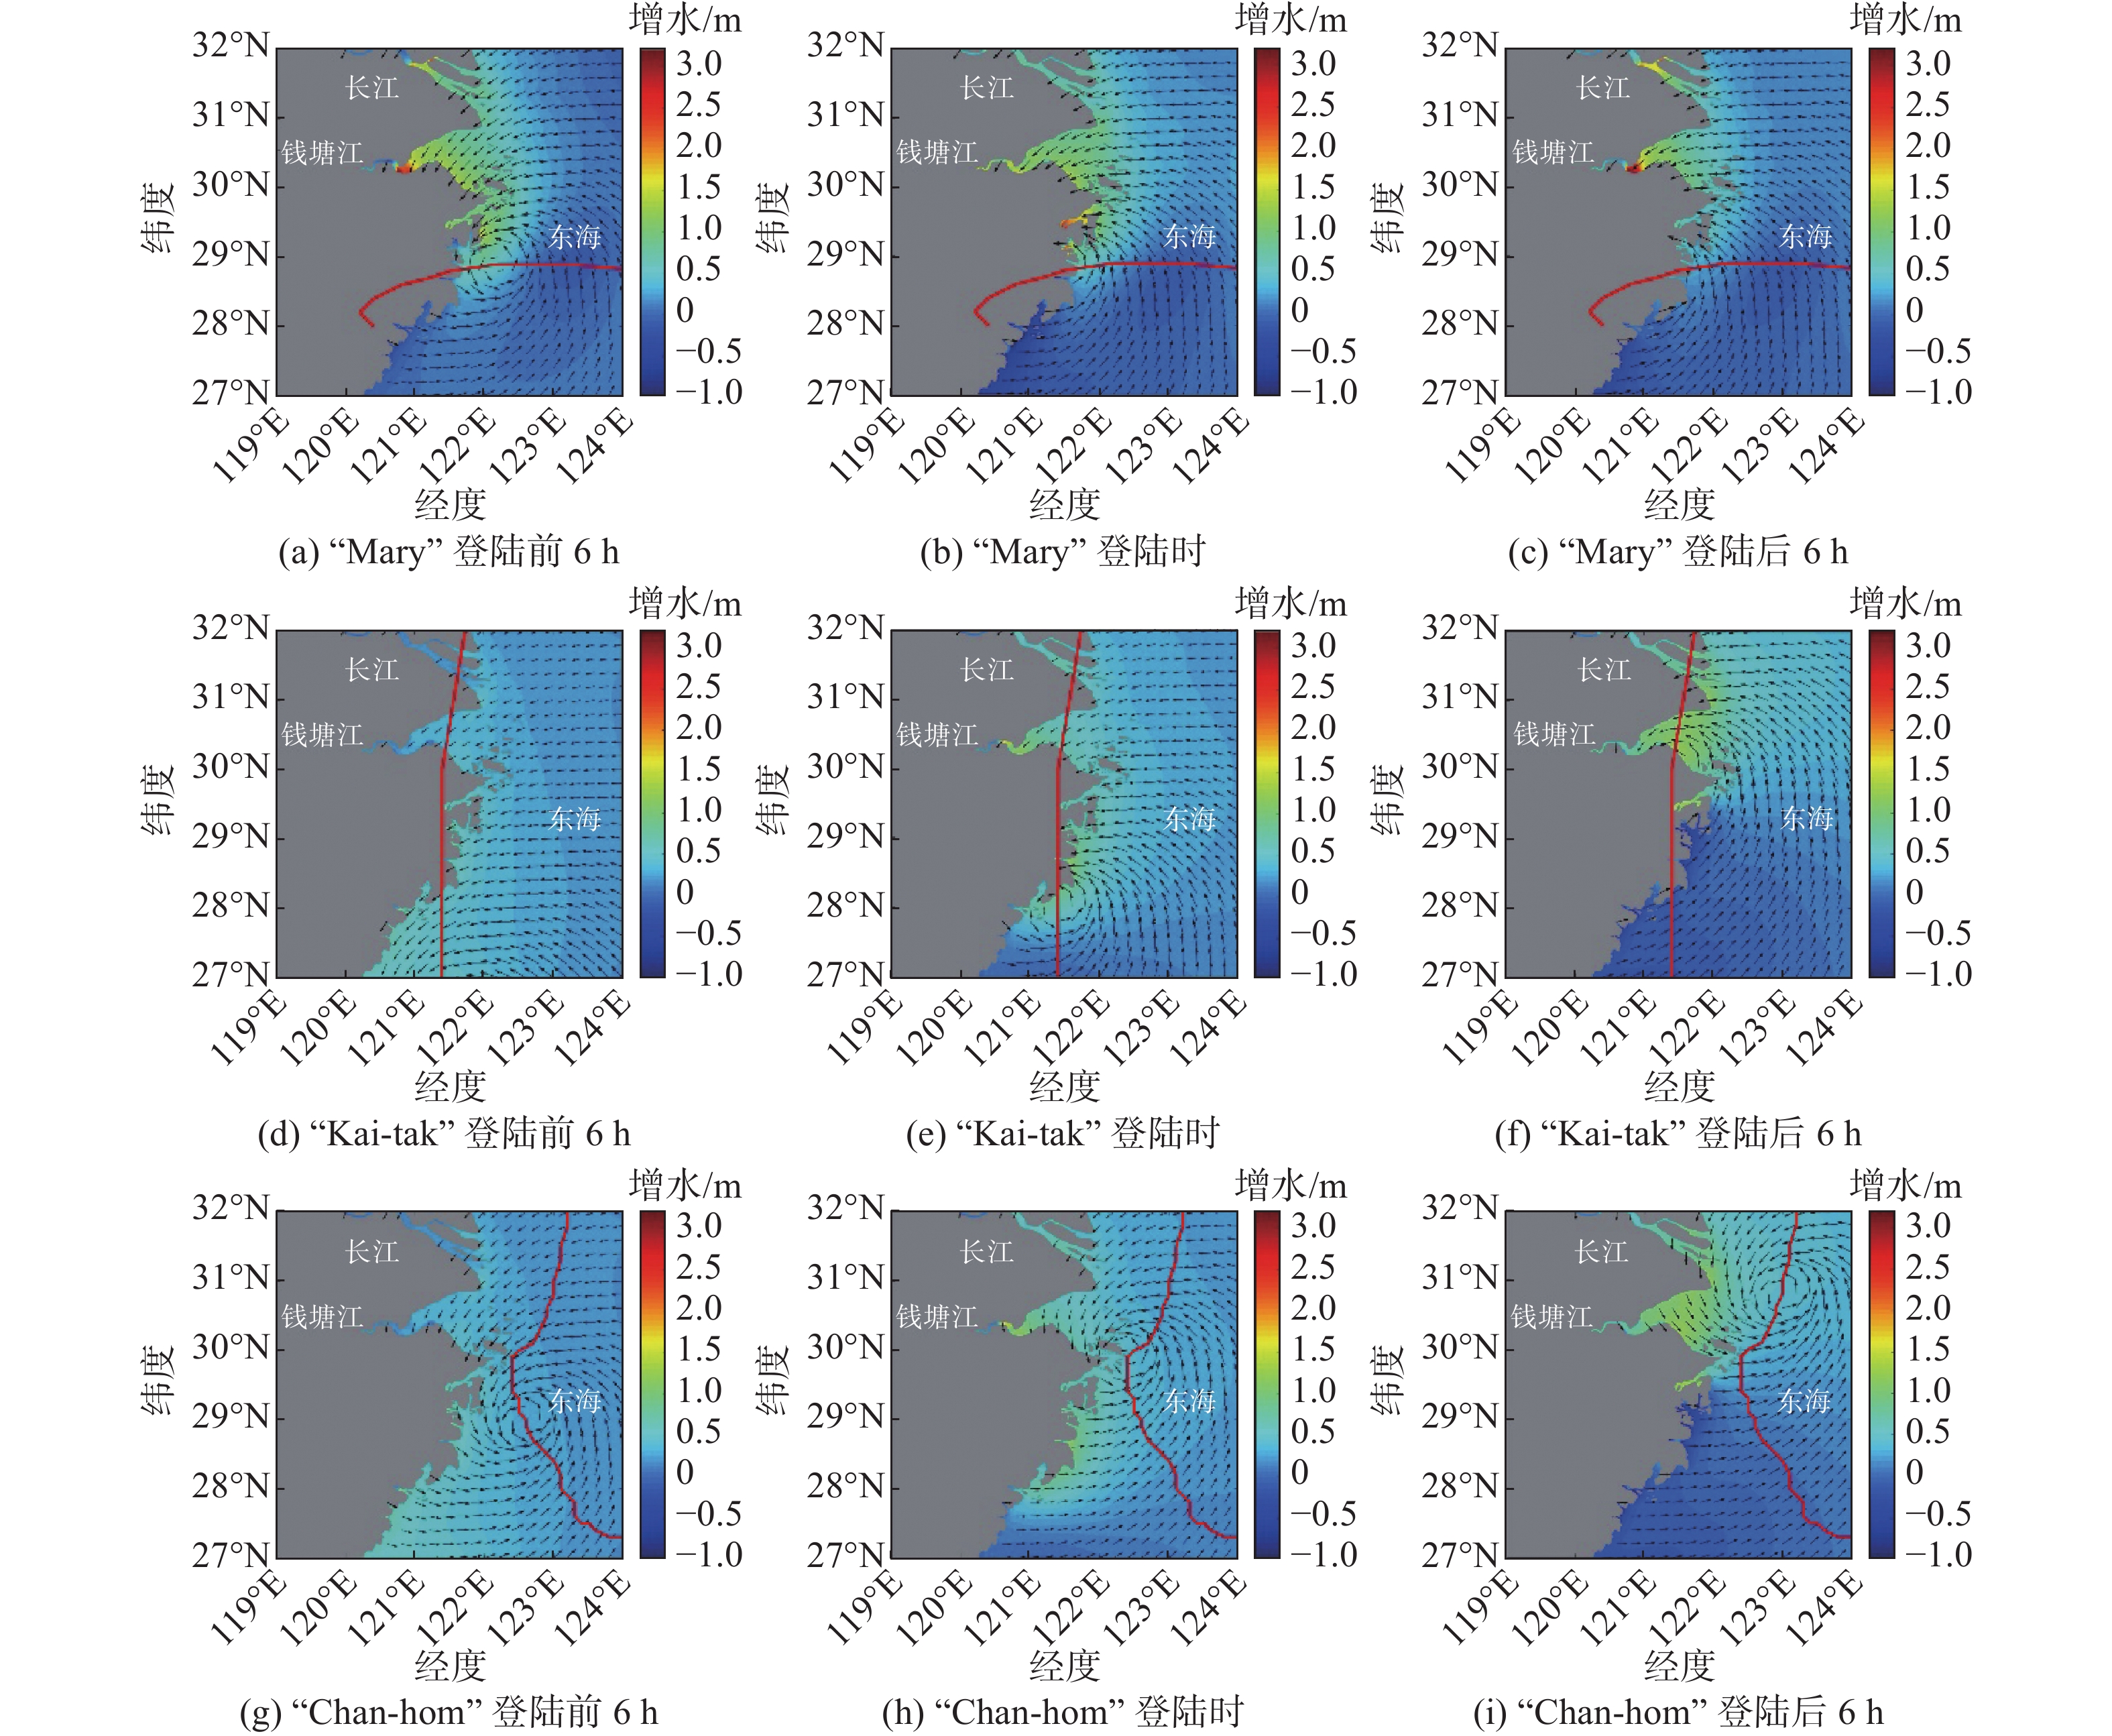
![]()
图 9 台风登陆前后增水及风场
Figure 9. Horizontal distribution of surges and winds before and after the typhoon landfall
![]()
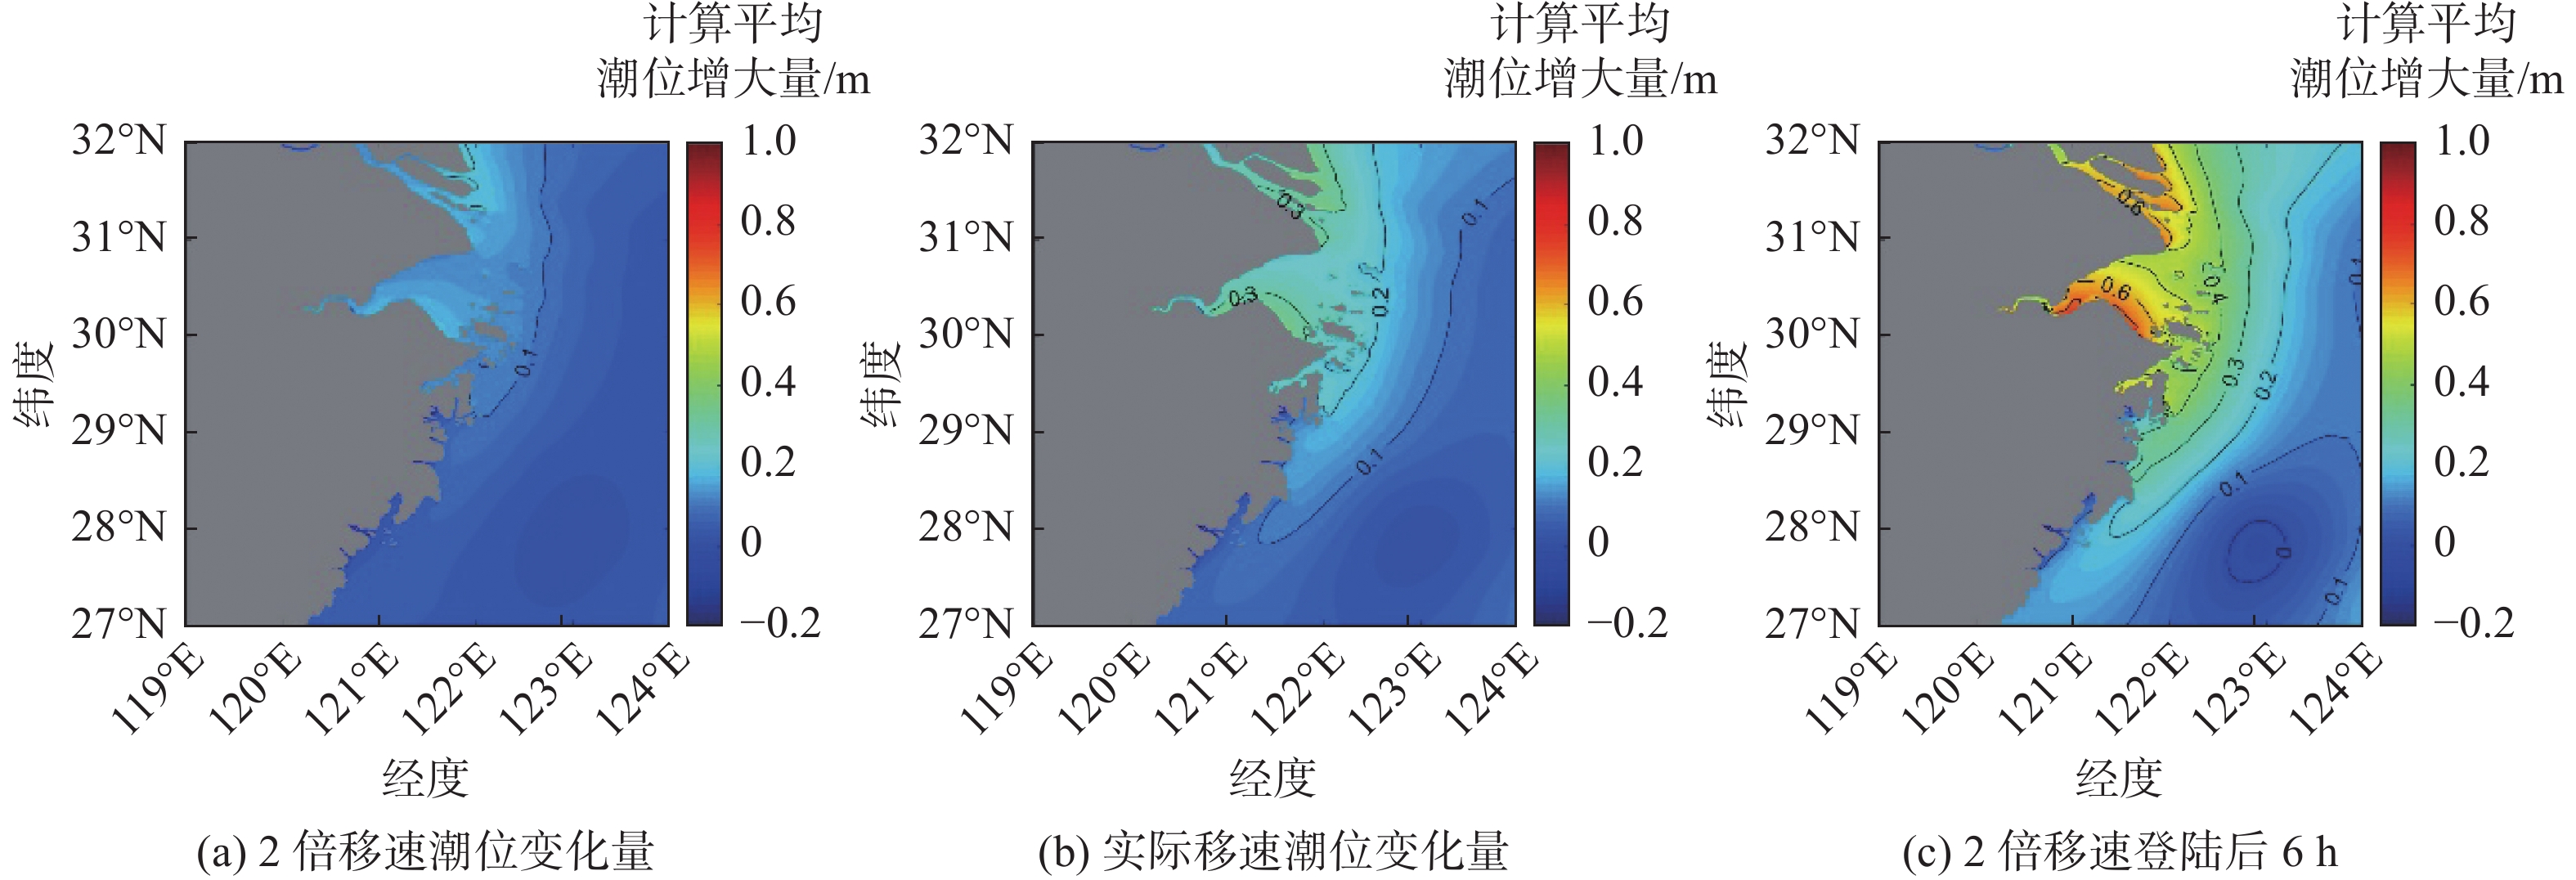
图 10 不同移速下平均潮位变化图(相对无风情况)
Figure 10. Averaged tidal level changes at different moving speeds (relative to no wind)
表 1 不同移速下最大增水和最大风速时刻对比
Table 1 Comparison of maximum surge and maximum wind speed at different moving speeds
测站位置 移速 最大风速时刻 风速/(m/s) 最大增水时刻 增水/m 朱家尖 2倍移速 2015-07-11T16:00(登陆前) 28.77 2015-07-11T16:00 1.25 2015-07-11T18:00(登陆后) 30.44 实际移速 2015-07-11T14:00(登陆前) 29.56 2015-07-11T14:00 1.20 2015-07-11T19:00(登陆后) 29.55 50%移速 2015-07-11T10:00(登陆前) 30.16 2015-07-11T10:00 1.28 2015-07-11T21:00(登陆后) 28.46 舟山外海 2倍移速 2015-07-11T17:00 31.48 2015-07-11T12:00 0.56 实际移速 2015-07-11T10:00 27.70 2015-07-10T22:00 0.37 50%移速 2015-07-11T2:00 26.59 2015-07-10T22:00 0.34  下载: 导出CSV
-
[1] CHURCH J A, CLARK P U, CAZENAVE A, et al. Sea level change[M]∥STOCKER T F, QIN D, PLATTNER G K, et al. Climate Change 2013: The Physical Science Basis. Contribution of Working Group I to the Fifth Assessment Report of the Intergovernmental Panel on Climate Change. Cambridge: Cambridge University Press, 2013: 1137-1216.
[2] PARK D S R, HO C H, CHAN J C L, et al. Asymmetric response of tropical cyclone activity to global warming over the North Atlantic and western North Pacific from CMIP5 model projections[J]. Scientific Reports, 2017, 7: 41354. doi: 10.1038/srep41354
[3] PENG M C, XIE L, PIETRAFESA L J. A numerical study of storm surge and inundation in the Croatan-Albemarle-Pamlico Estuary System[J]. Estuarine, Coastal and Shelf Science, 2004, 59(1): 121-137. doi: 10.1016/j.ecss.2003.07.010
[4] REGO J L, LI C Y. On the importance of the forward speed of hurricanes in storm surge forecasting: a numerical study[J]. Geophysical Research Letters, 2009, 36(7): L07609.
[5] THUY N B, KIM S, ANH T N, et al. The influence of moving speeds, wind speeds, and sea level pressures on after-runner storm surges in the Gulf of Tonkin, Vietnam[J]. Ocean Engineering, 2020, 212: 107613. doi: 10.1016/j.oceaneng.2020.107613
[6] THOMAS A, DIETRICH J, ASHER T, et al. Influence of storm timing and forward speed on tides and storm surge during Hurricane Matthew[J]. Ocean Modelling, 2019, 137: 1-19. doi: 10.1016/j.ocemod.2019.03.004
[7] KWON Y Y, CHOI J W, KWON J I. Simulation of storm surge due to the changes of typhoon moving speed in the south coast of Korean peninsula[J]. Journal of Coastal Research, 2020, 95(Suppl1): 1467. doi: 10.2112/SI95-283.1
[8] MUSINGUZI A, AKBAR M K. Effect of varying wind intensity, forward speed, and surface pressure on storm surges of hurricane rita[J]. Journal of Marine Science and Engineering, 2021, 9(2): 128. doi: 10.3390/jmse9020128
[9] DU M, HOU Y J, QI P, et al. The impact of different historical typhoon tracks on storm surge: a case study of Zhejiang, China[J]. Journal of Marine Systems, 2020, 206: 103318. doi: 10.1016/j.jmarsys.2020.103318
[10] YIN C T, ZHANG W S, XIONG M J, et al. Storm surge responses to the representative tracks and storm timing in the Yangtze Estuary, China[J]. Ocean Engineering, 2021, 233: 109020. doi: 10.1016/j.oceaneng.2021.109020
[11] WANG J, YI S, LI M Y, et al. Effects of sea level rise, land subsidence, bathymetric change and typhoon tracks on storm flooding in the coastal areas of Shanghai[J]. Science of the Total Environment, 2018, 621: 228-234. doi: 10.1016/j.scitotenv.2017.11.224
[12] 韩树宗, 潘嵩. 杭州湾台风风暴潮增水过程的数值分析[J]. 中国海洋大学学报(自然科学版),2013,43(7):1-6 doi: 10.16441/j.cnki.hdxb.2013.07.001 HAN Shuzong, PAN Song. Numerical simulation and analysis of storm surge in the Hangzhou Bay[J]. Periodical of Ocean University of China, 2013, 43(7): 1-6. (in Chinese) doi: 10.16441/j.cnki.hdxb.2013.07.001
[13] 钟汕虹. 基于改进风场的舟山渔港风暴潮模拟[D]. 杭州: 浙江大学, 2019. ZHONG Shanhong. Improved wind-field-based simulation of storm surge in Zhoushan fishery harbor[D]. Hangzhou: Zhejiang University, 2019. (in Chinese)
[14] CHU D D, NIU H B, QIAO W L, et al. Modeling study on the asymmetry of positive and negative storm surges along the southeastern coast of China[J]. Journal of Marine Science and Engineering, 2021, 9(5): 458. doi: 10.3390/jmse9050458
[15] YING M, ZHANG W, YU H, et al. An overview of the China meteorological administration tropical cyclone database[J]. Journal of Atmospheric and Oceanic Technology, 2014, 31(2): 287-301. doi: 10.1175/JTECH-D-12-00119.1
[16] LU X Q, YU H, YING M, et al. Western north Pacific tropical cyclone database created by the China meteorological administration[J]. Advances in Atmospheric Sciences, 2021, 38(4): 690-699. doi: 10.1007/s00376-020-0211-7
[17] 张西琳, 楚栋栋, 张继才, 等. 东南沿海台风风暴潮增水过程中非线性机制和地形的作用研究: 以1509号台风“灿鸿”为例[J]. 海洋与湖沼,2020,51(6):1320-1331 doi: 10.11693/hyhz20191200279 ZHANG Xilin, CHU Dongdong, ZHANG Jicai, et al. Effects of nonlinear terms and topography on storm surges in the southeast seas of China: a case study of typhoon Chan-hom[J]. Oceanologia et Limnologia Sinica, 2020, 51(6): 1320-1331. (in Chinese) doi: 10.11693/hyhz20191200279
[18] DHI (Danish Hydraulic Institute). MIKE21 & MIKE3 flow model hydrodynamic and transport module scientific documentation[M]. Denmark: DHI Water & Environment, 2014.
[19] HOLLAND G J. An analytic model of the wind and pressure profiles in hurricanes[J]. Monthly Weather Review, 1980, 108(8): 1212-1218. doi: 10.1175/1520-0493(1980)108<1212:AAMOTW>2.0.CO;2
[20] HARPER B A, HOLLAND G J. An updated parametric model of the tropical cyclone[C]∥American Meteorological Society. Proceedings of 23rd Conference Hurricanes and Tropical Meteorology. Dallas: Texas, 1999: 10-15.
[21] WILLOUGHBY H E, RAHN M E. Parametric representation of the pri “Mary” hurricane vortex. part I: observations and evaluation of the Holland (1980) model[J]. Monthly Weather Review, 2004, 132(12): 3033-3048. doi: 10.1175/MWR2831.1
[22] LOVE G, MURPHY K. The operational analysis of tropical cyclone wind fields in the Australian northern region[J]. Northern Territory Region Research Papers, 1985, 85: 44-51.
[23] HUBBERT G D, HOLLAND G J, LESLIE L M, et al. A real-time system for forecasting tropical cyclone storm surges[J]. Weather and Forecasting, 1991, 6(1): 86-97. doi: 10.1175/1520-0434(1991)006<0086:ARTSFF>2.0.CO;2
[24] HARPER B A. Tropical cyclone parameter estimation in the Australian region[R]. Perth: Systems Engineering Australia Pty Ltd for Woodside Energy Ltd , 2002: 83.
[25] VICKERY P J, SKERLJ P F, STECKLEY A C, et al. Hurricane wind field model for use in hurricane simulations[J]. Journal of Structural Engineering, 2000, 126(10): 1203-1221. doi: 10.1061/(ASCE)0733-9445(2000)126:10(1203)
[26] 应王敏, 郑桥, 朱陈陈, 等. 基于SWAN模式的“灿鸿”台风浪数值模拟[J]. 海洋科学,2017,41(4):108-117 doi: 10.11759/hykx20160919002 YING Wangmin, ZHENG Qiao, ZHU Chenchen, et al. Numerical simulation of “Chan-Hom” typhoon waves using SWAN model[J]. Marine Sciences, 2017, 41(4): 108-117. (in Chinese) doi: 10.11759/hykx20160919002
[27] MATSUMOTO K, TAKANEZAWA T, OOE M. Ocean tide models developed by assimilating TOPEX/POSEIDON altimeter data into hydrodynamical model: a global model and a regional model around Japan[J]. Journal of Oceanography, 2000, 56: 567-581. doi: 10.1023/A:1011157212596
[28] 中华人民共和国水利部. 中国河流泥沙公报2020[M]. 北京: 中国水利水电出版社, 2021. Ministry of Water Resources of the People’s Republic of China. China river sediment bulletin 2020[M]. Beijing: China Water Power Press, 2021. (in Chinese)
[29] WILLMOTT C J. On the validation of models[J]. Physical Geography, 1981, 2(2): 184-194. doi: 10.1080/02723646.1981.10642213
[30] MARÉCHAL D. A soil-based approach to rainfall-runoff modelling in ungauged catchments for England and Wales[D]. Bedford Shire: Cranfield University, 2004.
[31] HUSSAIN M A, TAJIMA Y, HOSSAIN M A, et al. Impact of cyclone track features and tidal phase shift upon surge characteristics in the bay of Bengal along the Bangladesh coast[J]. Journal of Marine Science and Engineering, 2017, 5(4): 52. doi: 10.3390/jmse5040052


计量
- 文章访问数: 138
- HTML全文浏览量: 35
- PDF下载量: 38
